Sound - Messages
Quick Sound Loss.smz (132.15 KiB) downloaded 993 time(s).
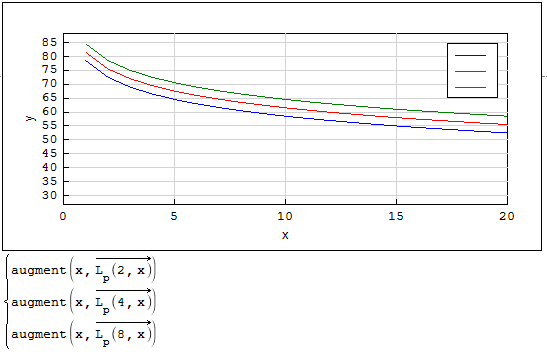
WroteI think I need a program loop to get the graph to show up correctly.Suggestions?
"Why does log10 look different ?"
because you have two different formulas, thus two different results
The second equation is off/not evaluated. Graphically log to base x and log10 display differently. Question is about graph though

we have:
log(a/b)=log(a)-log(b)|10*log10(a/b)| = 10*(log10(b)-log10(a)) = 10*(log10(f(x))-log10(Q)) = 10*log10(f(x))-10*log10(Q)10*log10(f(x))-10*log10(Q) = const-10*log10(Q)
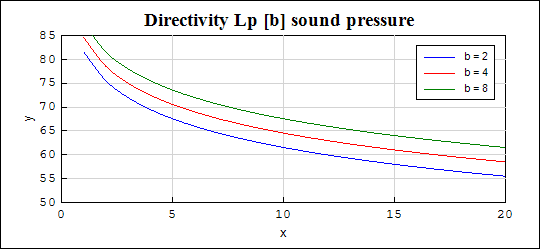
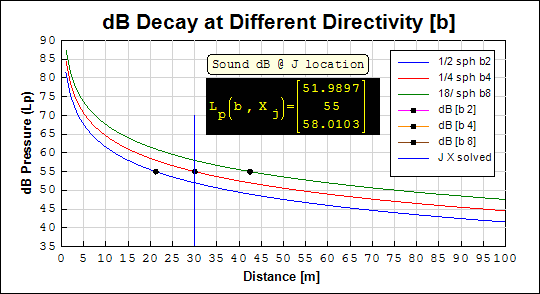
10*log10(2)=3, 10*log10(4)=6, 10*log10(8)=9 (approx)
Lp(Q,x)=Lw(Q,1.5)-|10*log10(a/b)|=Lw(Q,1.5)-const+10*log10(Q)In fact, if you go further, you can do the same for Lw:
Lw(Q,dist) = Ltot+|10*log10(Q/f(dist))| = Ltot+10*log10(f(dist))-10*log10(Q) = const2-10*log10(Q)
Lp(Q,x) = Lw(Q,1.5)-const1+10*log10(Q) = const2-10*log10(Q)-const1+10*log10(Q) = const2-const1 = constantYou have sound pressure measured by the vendor -> You have to calculate the power level for the distance and directivity condition of the vendor
Then you have the sound power level of your source... it's a constant! Use this value to estimate the sound power at various distances for various directivity conditions!
Quick Sound Loss - rev.1.sm (134.93 KiB) downloaded 1017 time(s).
I did the same thing, where I assumed directivity is b=2 on Lw. I'll just document that and move on as the rest of the math appears to work out
WroteJean,
The second equation is off/not evaluated.Graphically log to base x and log10 display differently.Question is about graph though
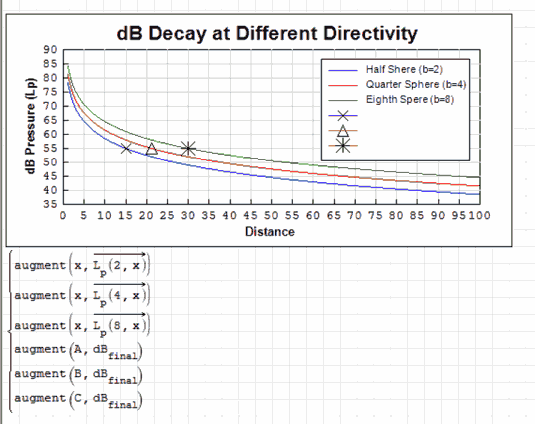
Few more things you can do as real project.
Line style "splines" is a bit smoother in the low region.
Quick Sound Loss - rev.2.sm (134.54 KiB) downloaded 997 time(s).
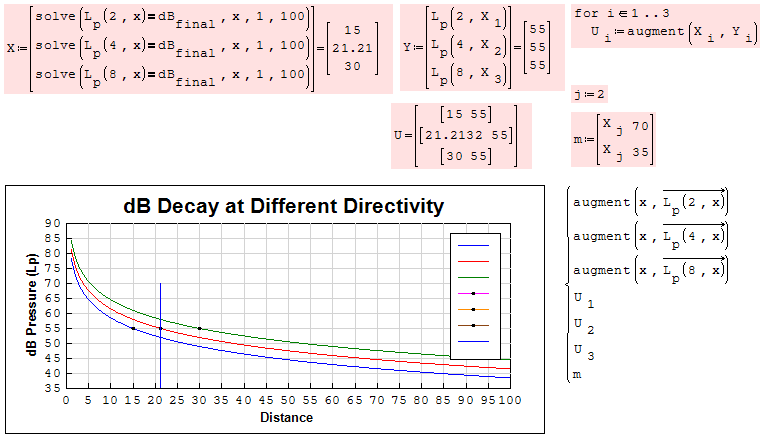
OK, here I am as I had done most of the items that Davide and Jean added. Now I would like to add a "dot" or a vertical line where the dB.final is. Please use this sheet
Quick Sound Loss.smz (135.1 KiB) downloaded 987 time(s).
Jean, I did not see where you used a spline
All should I be using "cinterp" to place the "dot?
Quick Sound Loss - rev.1.sm (134.93 KiB) downloaded 957 time(s).
Best Regards
Carlos
WroteJean, I did not see where you used a spline
All should I be using "cinterp" to place the "dot?
1. spline is for line style ... line/spline.
2. what that gyzma #,#,#,,,does in maths ?
3. X_Y plot does not support " in your plot suggestion
4. X_Y is for final/final/final ... project
once done, if you rework something above=> it will freak the plot
X_Y plot has slightly pregnant memory. Doctored in red .
Quick Sound Loss (3).sm (140.83 KiB) downloaded 1189 time(s).
WroteSomething like this?
Carlos,
I think you attached the wrong file. Yes, that is what I was looking for.
Jean,
When I double click the graph on your latest file, my computer locks up. I'm on version 0.99.6671.
NOW my file is locking up!!! ARRG
Quick Sound Loss (1)_r1.sm (140.03 KiB) downloaded 1226 time(s).
Best Regards
Carlos
WroteJean,
When I double click the graph on your latest file, my computer locks up.I'm on version 0.99.6671.
My 6179 opens your 6671 ... your 6671 freezes opening 6179
Is it a bug ?
BTW, attach an image of the polynomials that fail [as you reported].
WroteFew more things you can do as real project.
Thanks Elsid,
Nice project, saved for myself, you can have it as is.
Jean
Inst_dB Sound.sm (142.33 KiB) downloaded 1058 time(s).
I found a quirk. Depending on values dB initial values, neither solve nor FindRoot is functional. I was plugging in values by hand without seeing an issue. I tried a "higher" dB set of values (86 vs 75) for equipment and the calculation *zap*
Quick Sound Loss.smz (168.74 KiB) downloaded 1014 time(s).
Also, the X-Y plot legend information *ZAP*
WroteWell, Here we go again ...
I found a quirk.Depending on values dB initial values, neither solve nor FindRoot is functional.I was plugging in values by hand without seeing an issue.I tried a "higher" dB set of values (86 vs 75) for equipment and the calculation *zap*
That one was Doctored and you don't use the Doctored version.
Explained before, if above X_Y something is Doctored, zap.
Quick Sound Loss (4) Doctored 20180413.sm (167.01 KiB) downloaded 1012 time(s).
Edit: Two bugs
- X-Y Plot. If functions crash, *Zap* to the legend titles. All other titles OK. Legend is empty due to laziness after last 5 crashes
- solve(4) did not like trying to cancel units in the denominator of the final function (#dist). As I was adding units to x:0-100 FT and dividing the units meters in the function, the function crashed in the solve block (Just the function, with all values plugged in except for x = vector, so it's a solve(4) issue).
There is additional documentation and function definition updates. Sanity check the graph x scale (adjusted for feet since I'm in the US). Should be good now
WroteFound the issue.I'll post revamp file.Still having issues in that X-Y plot Labels for the legend *zap*
Clik on "list", edit "series name".
- No longer works if I redefine the logarithmic sum with vectorize
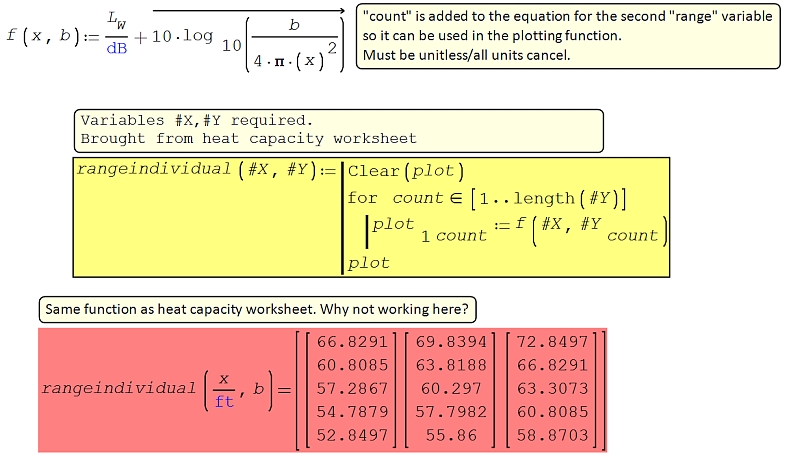
- I cannot get the "heat capacity function" to work for ploting
Sound Loss (Quick).sm (476.36 KiB) downloaded 1098 time(s).
Thanks for the help.
1. Use count inside rangeindividual, but not outside. You use it in f(x, b ), and guess that could be problematic.
2. After that, you divide x by 'm in f and x by feet in rangeindividual, choose only one.
3. Maybe here don't affect, but if rangeindividual have not f(#,#) as parameter, define f before rangeindividual, you know, just in case.
Best regards.
Alvaro.
- New Posts
- No New Posts