1 страниц (15 вхождений)
2D Plots - What am I missing? - Сообщения
Trying to plot a variety of functions and nothing shows up in the plots.
I have 23 yrs of MathCad experience, but cannot figure out what Smath is looking for to plot three very simple function (See attached file).
Additionally, I am not sure why an equation needs vectorized to output the answers in the normal distribution equation.
Equation 1 - Normal distribution does not solve as a function until it is vectorized. Why?
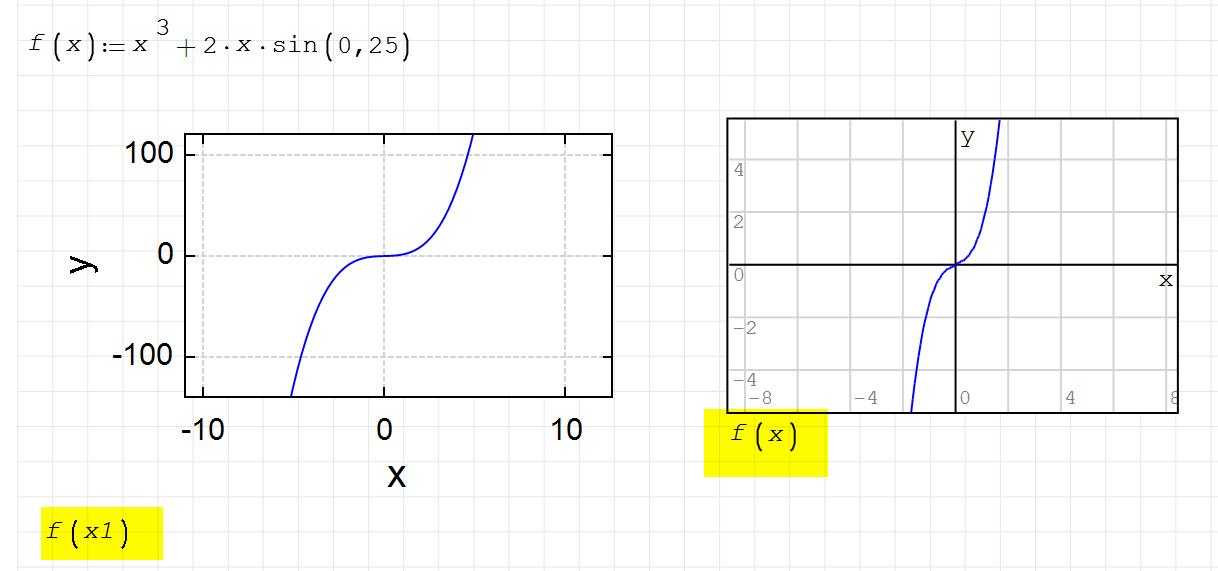
Equation 2 - f(x):x^3+2*x*sin(0.25) solves without vectorization but will not plot. Why?
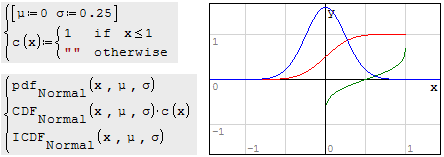
Equation 3 - f(x):vectorize(1/{σ*sqrt(2*π)}*e^{-1/2*({x-μ}/σ)^2}) solves with vectorization but does not plot (2D or X-Y plot method). Why?
Smath - 2D Plots.sm (15,56 КиБ) скачан 1006 раз(а).
I have 23 yrs of MathCad experience, but cannot figure out what Smath is looking for to plot three very simple function (See attached file).
Additionally, I am not sure why an equation needs vectorized to output the answers in the normal distribution equation.
Equation 1 - Normal distribution does not solve as a function until it is vectorized. Why?
Equation 2 - f(x):x^3+2*x*sin(0.25) solves without vectorization but will not plot. Why?
Equation 3 - f(x):vectorize(1/{σ*sqrt(2*π)}*e^{-1/2*({x-μ}/σ)^2}) solves with vectorization but does not plot (2D or X-Y plot method). Why?
Smath - 2D Plots.sm (15,56 КиБ) скачан 1006 раз(а).
Equation 2 also needs vectorized to get the correct results.
You don't have to do this in MathCad, why here?
You don't have to do this in MathCad, why here?

You have defined a vector of values for x. If you use the X-YPLOT plugin you need to change the variable. If instead you use SM native 2D graph then it already works as you expect
sergio
sergio
First Solution Found
This allowed me to plot Normal Distribution Function.
augment(x,f(x))
This allowed me to plot Normal Distribution Function.
augment(x,f(x))
Solved for now. On with the learning experience.
Thanks....
Thanks....
Hi, if you need a quick plot I recommend you use 2D standard plot you can plot functions f(x) directly , if you need a more configurable plot use XY plot but you need to put your data in a special format. Файл не найден.Файл не найден.
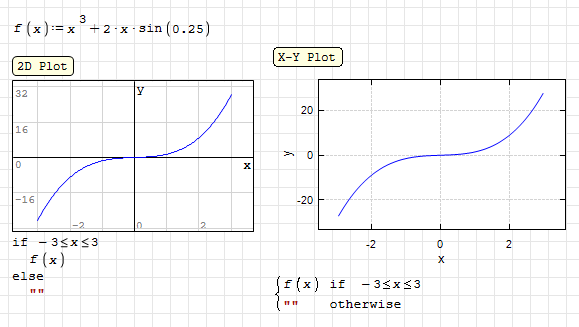
You don't need to use range() and augment() if you want to plot sections.
You can limit it with if-else() or cases().
Regards
You can limit it with if-else() or cases().
Regards
WroteTrying to plot a variety of functions and nothing shows up in the plots.
I have 23 yrs of MathCad experience, but cannot figure out what Smath is looking for to plot three very simple function (See attached file).
Additionally, I am not sure why an equation needs vectorized to output the answers in the normal distribution equation.
1. Show the two other ones on same document for doctoring.
2. Your sigma makes no sense !
3. BTW, in Samples you should find my Stat Treasury [10 WS]
Hard to find such immense Compendium.
4. If you can't download, please let me know
Welcome ... Jean.
Smath - 2D Plots.sm (17,77 КиБ) скачан 1002 раз(а).
... besides the pure statistical application,
you can use to fit data sets [Fréchet US Rainfall ...]
you can use to fit data sets [Fréchet US Rainfall ...]
Wrote... besides the pure statistical application,
you can use to fit data sets [Fréchet US Rainfall ...]
There is about 24 built-in PDF in Smath ... f(x) menu
as well as CDF, ICDF
WroteEquation 1 - Normal distribution does not solve as a function until it is vectorized. Why?
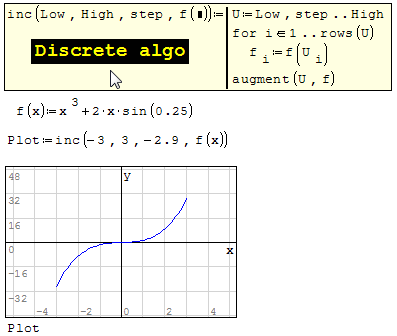
1. Discretize the range you want and plot ... No vectorize.
2. Plot scalar directly.
Paecific.sm (9,62 КиБ) скачан 997 раз(а).
... in most applications inc(Low,High,step,f(#)) is preferred
Paecific.sm (14,25 КиБ) скачан 1041 раз(а).
Paecific.sm (14,25 КиБ) скачан 1041 раз(а).
Scalar plots have limited use, mostly confirm the project.
Discrete plot can be used for subsequent application/export.
1. Collapsed the algo at top utilities.
2. Use it infinitely in-situ use [range each f(x) at will].
Discrete plot can be used for subsequent application/export.
1. Collapsed the algo at top utilities.
2. Use it infinitely in-situ use [range each f(x) at will].
1 страниц (15 вхождений)
- Новые сообщения
- Нет новых сообщений