2D Plot Vectorised vector - Not sure this is possible - Сообщения
Can we plot, quickly, a function that uses two ranges? I cannot find anything in my notes that will help me Heat Capacity.sm (14,56 КиБ) скачан 964 раз(а).
WroteCan we plot, quickly, a function that uses two ranges ?
The 2nd plot is only the XY axes system, as r and t are just multiple.
Maybe, there is a missing link ?
Cheers ... Jean
Heat Capacity.sm (22,16 КиБ) скачан 940 раз(а).

Your file is giving me some of the dreaded "black boxes". Easy fix on the sheet. Just pointing it out as you are using "0.98.6179" and latest stable is "0.99.7610"
Thanks for your help
Ber7,
Thank you as well
WroteJean,
Your file is giving me some of the dreaded "black boxes". Easy fix on the sheet. Just pointing it out as you are using "0.98.6179" and latest stable is "0.99.7610"
Thanks for your help
From recollection black boxes started appearing at 7610.
Reported many times by many ... not doctored then suffer.
The converse is true, i.e: 6179 open 7610 and more recent black.
Is it defendable ? ... update , you are retarded.
The truth is: it is a bug and I sign !
SS 6179 does not open black all 7610 and later.
Thanks Ber7, you got it right IMHO.
Cheers ... Jean
Is there a way to "functionalize" the loop? I'm having an issue with UNITS (required). Not possible, because of units, is an acceptable answer.Heat Capacity Function.sm (28,72 КиБ) скачан 919 раз(а).
WroteTrying to take Ber7's help a little further.
Is there a way to "functionalize" the loop?
Work sheet empty ... incorrect format.
Just re-post Ber7 document !

Looks like I was not clear with my question.
- Where you able to open my file? Jean had issues.
- I am trying to "generalize/discretize the loop" for other equations/functions where I have two range variables
- At one point, I had a third variable and that was the function/equation f(#x,#y):= ????; plot2rangevars:=(#x,#y,f(#x,#y)):={program}
Re-uploaded file without a closed area to see if this helps Jean
Heat Capacity Function.sm (28,95 КиБ) скачан 946 раз(а).
WroteRe-uploaded file without a closed area to see if this helps Jean
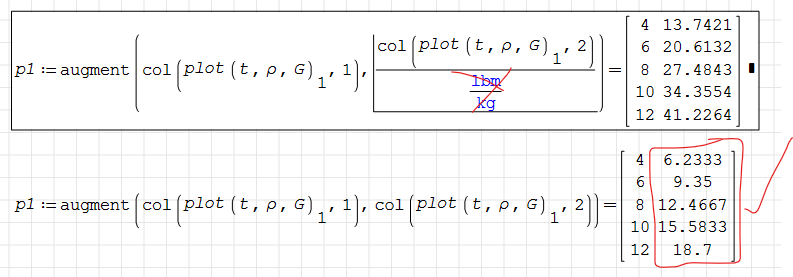
Just opened Ber7 document and completed to export the multiple data sets.
You can tabulate as well p2, p3, ... p6 then make a unique export table.
The meshed pivot is an exceptional tool, save it.
Cheers ... Jean
Plot Otherwise SS6179.sm (35,29 КиБ) скачан 946 раз(а).

WroteThe meshed pivot is an exceptional tool, save it.
Cheers ... Jean
Plot Otherwise SS6179.sm (35,29 КиБ) скачан 946 раз(а).
You need to delete the units in the your version as BER7 had accounted for it in the function ... I know you hate units. I need to digest your follwup posted sheet
WroteYou need to delete the units in the your version as BER7 had accounted for it in the function
You can have it otherwise as well.
Page8 Elsid.sm (59,07 КиБ) скачан 1061 раз(а).
Really helpful. Is there a reason that a legend cannot be created on the plots (X-Y Plot) that are individual colors? I realize you used the built in graph and I updated my snippet sheet with the X-Y Plot
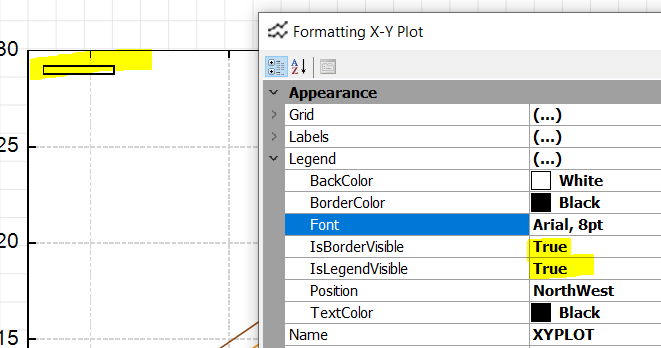
NEVERMIND ... It'S under TRACES, not LEGEND
WroteThank you Jean,
Really helpful. Is there a reason that a legend cannot be created on the plots (X-Y Plot) that are individual colors? I realize you used the built in graph and I updated my snippet sheet with the X-Y Plot
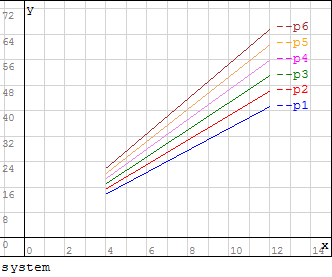
X_Y plot does not recognize the multiple linterp, thus plots one trace only.
Alternately, you can add some sort of legend on the QuickPlot.
Cheers ... Jean
Page8 Elsid.sm (60,17 КиБ) скачан 1097 раз(а).
This has turned into a rabbit hole to document (notes) how to plot an equation with two range variables with a function. Is there a way to eliminate #X1 (t1 in this example)? In short, is there a function? or way to eliminate the units from #X (t in this example). Heat Capacity Function1.sm (20,42 КиБ) скачан 1433 раз(а).
Didn't work how I wanted, but similar to dividing vectorized (t/Unitof(t)).
Ber7 did the 2 var collection in nested vector form,
my last version is table style, much more convivial as I'm used to do.
Units are just a pen in the ass[hole].
A good way is to work units-less, then append silent units.
Cheers ... Jean
I'm now trying to figure this out to fully make a "snippet" function as long as I define the the empirical equation divided by the units. It would have multiple applications for me.

Were you able to open up my last attachment? Jean had issues again

This is my current hang up with the units
- Новые сообщения
- Нет новых сообщений