EXCEL (2003+) I/O with recalculation and export to PNG - Uses EXCEL PIA (2003+) to import/export data to and from XLS/XLSX files - Сообщения
and transited to Excel to further paste back to Smath. Wouldn't it be simpler to
capture directly from Pareto, resize/resample, reduce 256 colors and paste in Smath ?
Jean
Take for example charts. Excel formatting is miles beyond what Smath can do. Use excel_IN to feed the data, excel_PNG to dynamically display the chart.
What do you use for sharpening tool? Looks neat.
Thanks
P.S.: I know that my fascination with excel is arguable. I am all about using best tool for the task; however, often I am strongly encouraged to use spreadsheets, or as it is with graphs, excel just does a better job than Smath.
WroteJean, in my work I would like to avoid manual copy paste of data where possible to eliminate human error. Also it is often that I need to update 20 excel screenshots in a .SM workbook.. This plugin together with image region does it all by itself every time the workbook is evaluated.
Take for example charts. Excel formatting is miles beyond what Smath can do. Use excel_IN to feed the data, excel_PNG to dynamically display the chart.
What do you use for sharpening tool? Looks neat.
Thanks
P.S.: I know that my fascination with excel is arguable. I am all about using best tool for the task; however, often I am strongly encouraged to use spreadsheets, or as it is with graphs, excel just does a better job than Smath.
================ I understand [my own way] all what you are doing ==============
I was Excel mad up to WIN Millenium. The switch to Mathcad 8 then 11 replaced my Excel
work because more oriented to solving maths. Since 2000, I have never opened Excel again.
My two most precious tools, companions of Smath are: WinGrab & IrfanView.
Same tools that I got mid 90. If an image is not compatible for pasting in WinGrab,
I transit to Paint, then paste in WinGrab for color reduction [256]. WinGrag will also capture image from web and from any screen display.
Often, images from *.PDF, web ... are poor quality [not sharp].
Then paste in IrfanView and use the "Sharpen" once or multiple times.
From the same IrfanView menu, you can "resize/resample" at whatever %
by respecting aspect ratio. Same quality than PhotoShop for 0$.
Naturally, if an image is to destroyed by JPEG, zoom[+] is poor.
You are right: Smath is more maths oriented than Graphs, thus combine + Excel.
Jean
In order for this to work update BOTH excel I/O and Image Region plugins.
Note that while graphics might look distorted in SMath (rendering of metafile to 96 system DPI), printing workbook to PDF results in high quality vector graphics.
All charts are taken from here as samples:
http://www.contextures.com/excelfiles.html#Charts
Файл не найден.Файл не найден.Файл не найден.
Primary benefit of using excel_IO for graphs is endless formatting possibilities.
Файл не найден.Файл не найден.
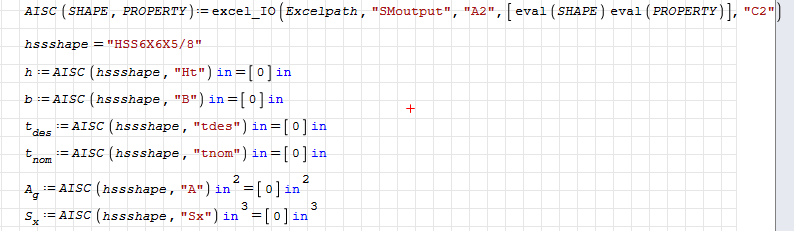
WroteThe excel_IO appears not to be working anymore as part of a custom function. It was working previously on my computer, but with one of the upgrades to SmathStudio it has stopped working. When the excel_IO is used as the right part of a custom function, the variables with equal signs get placed in the excel worksheet cells instead of the values of the variables. See the two screen shots below from the Steel Properties Look-up.sm and corresponding excel file. The excel_IO otherwise appears to work but not as right part of custom function with variable input.
I fixed the example: use line() function. I do not know why the behaviour differs with and without line; however, I did not spend much time investigating the behaviour once work around was found.
Steel Properties Look-up.sm (25,09 КиБ) скачан 1811 раз(а).
AISC Shape Lookup.xlsx (3,27 МиБ) скачан 1670 раз(а).
Also for excel screenshots I suggest using excel_EMF instead of excel_PNGv2 - produces great quality PDF prints. If you do, update both excel_IO and Image Region plugins to the latest version
WroteThanks for the work around and tips. Your plug-in is really valuable because linking excel and smath opens up many possibilities with engineering calculations. Wish the line function was not needed because you would not really think it was necessary in this case in my opinion. I hope it can be removed at some point.
I use this plugin all the time; likely for a very similar purpose. I do not think that the difference in behaviour with and without line function is something I can fix on my side.
The example was borrowed from one of the calculations by Jean Giraud.
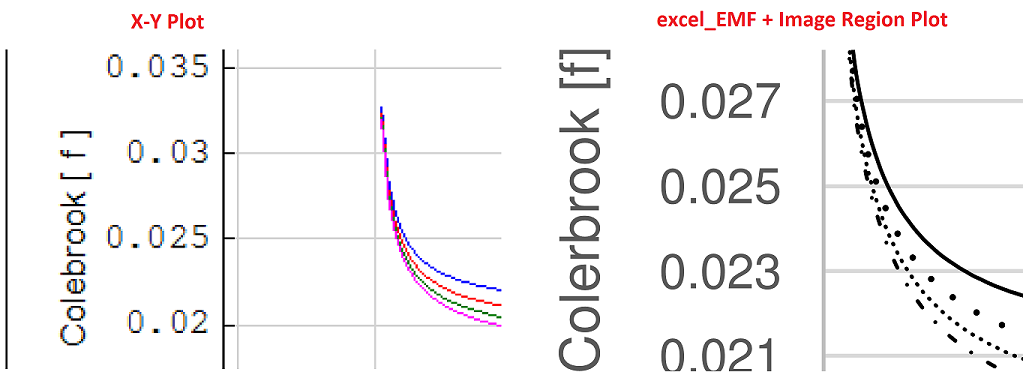
Note the difference of as-printed quality between X-Y Plot output and excel_EMF output.
Файл не найден.Файл не найден.Файл не найден.
My Excel 2003 opens your Excel sheet, but somethig(s) it does not like.
It must convert and the plots aren't managable, it's OK. I understand
your plug-in for those that don't work maths, also good for papers.
How did you get such a huge 7.75 MB image !
All the snippets I attach are captured from my 20 years old "WinGrab"
still freeware. After capture, select the portion then reduce colors
to 256 . Generally, WinGrab reduce 256 colors is better than my old
IrfanView. This snippet is 430 KB.
Smath is very convenient for working from files that are created from
the hard maths. As you can see: past the Moody creation, we just have
interest in retrieving any Colebrook 'f' [friction factor]. There is a
way to retrieve from specified Reynolds. It requires a module to search
through data table.
Cheers, Jean
There are two ways to display EXCEL plots / ranges:
1. excel_PNG - produces LARGE bitmap files that print well at 300+ DPI
2. excel_EMF - produces a clipboard of a metafile (native .net vector graphics) which results in a vector graphics PDF prints.
I like using excel_EMF - it produces best as-printed quality plots and is much faster than excel_PNG
Also I saw that you were spooling "Moody" function output to file to speed up processing. No need for that - just define Moody:=eval(your_code) so the function is not executed every time you call it in a SMath worksheet.
user defined function to perform cell Goal Seek
Файл не найден.Файл не найден.

Is there something that needs to be setup differently?
Thanks for any help.
WroteA couple of days ago when I started SMath Studio it listed the plug-in EXCEL (2003+) I/O to be updated. I updated the plug-in and after doing so it does not work the same as it did before. In my sheet, a function is setup to use the plug-in. The function now returns a matrix with a single element of zero were before the function would return a single decimal value.
Is there something that needs to be setup differently?
Thanks for any help.
Partially fixed, please check.
WroteWroteA couple of days ago when I started SMath Studio it listed the plug-in EXCEL (2003+) I/O to be updated. I updated the plug-in and after doing so it does not work the same as it did before. In my sheet, a function is setup to use the plug-in. The function now returns a matrix with a single element of zero were before the function would return a single decimal value.
Is there something that needs to be setup differently?
Thanks for any help.
Partially fixed, please check.
Uni, is there anything i can do on my end for the fix? Havent touched the plugin for years and appreciate the maintenance you have done
- Новые сообщения
- Нет новых сообщений