3D Plot Region - CreateMesh() and 3D Plot - Сообщения
Try method
http://en.smath.info/forum/yaf_postst2215_Transferring-three-dimensional-image-on-a-two-dimensional--flat--graph-by-prof--A-B-Ivanov.aspx

rod_spring1.sm (46,6 КиБ) скачан 1421 раз(а).
http://en.smath.info/forum/yaf_postst2215_Transferring-three-dimensional-image-on-a-two-dimensional--flat--graph-by-prof--A-B-Ivanov.aspx
rod_spring1.sm (46,6 КиБ) скачан 1421 раз(а).
am I wrong or the x and y axis are exchanged?
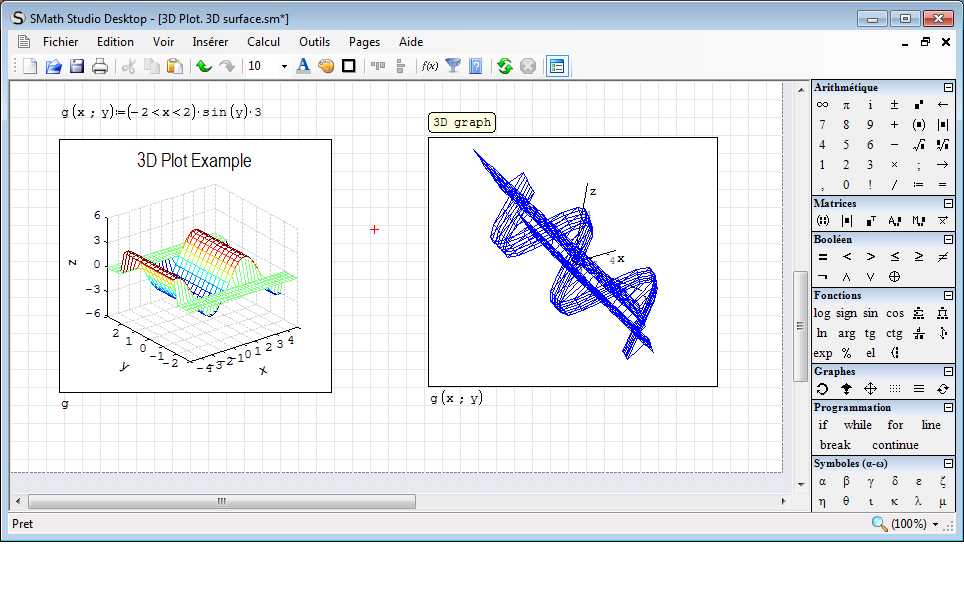
I have downloaded smath studio a few days ago and made some examples to be more familiar with the program. Today I have tested 3D plot and found 2 strange behaviour.
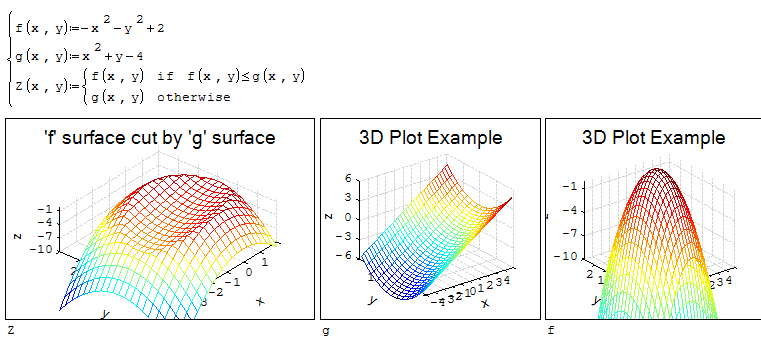
First on 3D plot x and y seems to be swapped
Second the same formula plotted by 3D plot and by 3D graph give a different view
I have downloaded smath studio a few days ago and made some examples to be more familiar with the program. Today I have tested 3D plot and found 2 strange behaviour.
First on 3D plot x and y seems to be swapped
Second the same formula plotted by 3D plot and by 3D graph give a different view

The SMath built-in 3D plot is left-handed, the 3DPlot Region is right-handed (being able to choose, I prefer the 2nd but is matter of taste) 
If you like my plugins please consider to support the program buying a license; for personal contributions to me: paypal.me/dcprojects
Thanks for answering.
But the sin function is defined with y as variable and the step function is defined with x as variable. On the 3D plot the sin is along the X axis and the step function along the Y one.
But the sin function is defined with y as variable and the step function is defined with x as variable. On the 3D plot the sin is along the X axis and the step function along the Y one.
is there a version of a tutorial for dummies for this plugin? I tried to figure it out on my own but can't get it to work.
I just wanted to try and plot a sphere for fun. maybe next would be plot a line / plane and see where it intersects the sphere.
I just wanted to try and plot a sphere for fun. maybe next would be plot a line / plane and see where it intersects the sphere.
WroteI just wanted to try and plot a sphere for fun.maybe next would be plot a line / plane and see where it intersects the sphere.
______________________________
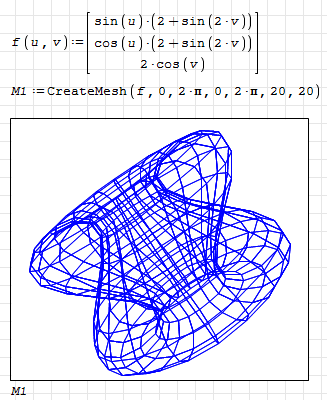
AFAIK, as far as I have experimented, the Maxima 3d plot is for parametric unctions
and the style in example. It does not plot "volume 3D", it does not take stacked arguments. Up until my help: zap for the sphere and the cutting plane. The 3D Smath default plot is just for fun, nothing to do, no color ... These two may help using this Maxima plot.
Jean
Contour X_Y plot.sm (56,37 КиБ) скачан 1412 раз(а).
Contour X_Y plot [More Parametric].sm (103,25 КиБ) скачан 1226 раз(а).

Updated.
Changes:
- CreateMesh(): (u,v) can be skipped for the function;
- 3D Plot Region: began updating the code (draft version).
Changes:
- CreateMesh(): (u,v) can be skipped for the function;
- 3D Plot Region: began updating the code (draft version).
Russia ☭ forever, Viacheslav N. Mezentsev
About 3D Plot. Unfortunately, the source code that I found requires significant improvement in order to display a family of graphs. I hope I have enough time and desire to bring this component to normal at last.
Russia ☭ forever, Viacheslav N. Mezentsev
3 пользователям понравился этот пост
Hello,
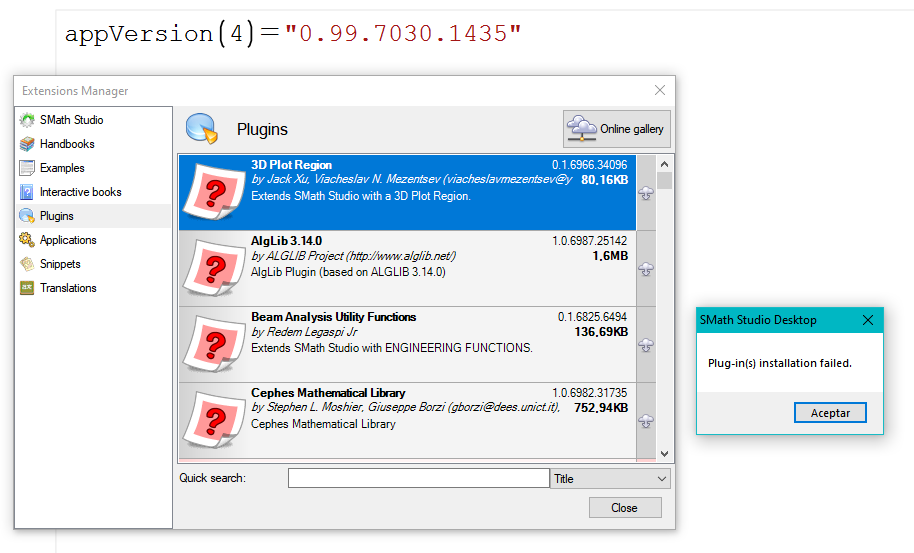
I really need this amazing plug-in to plot around a million independent points, but I am having this issue with the installation. Could someone help me?
Thank you in advance.
I really need this amazing plug-in to plot around a million independent points, but I am having this issue with the installation. Could someone help me?
Thank you in advance.
WroteONE million independent points,
plotted on device at eye resolution 1000000/1200=833 inches
plotted at PC screen resolution 1000000/96=10417 inches
WroteHello,
I really need this amazing plug-in to plot around a million independent points, but I am having this issue with the installation. Could someone help me?
Thank you in advance.
Unfortunately, I cannot build a project on the server. We will wait for an answer from the author of the program. As for the plugin itself, it is not yet complete. Displaying data is not intuitive.
Russia ☭ forever, Viacheslav N. Mezentsev
WroteDisplaying data is not intuitive.
1. ONE million data from surface f(x,y) ?
2. ONE million data as image: Gray scale, RGB ?
Not yet like the English dog.
If it looks like a dog, walks like a dog,
barks like a dog => it is a dog [big, small ?]
Wrote
1. ONE million data from surface f(x,y) ?
2. ONE million data as image: Gray scale, RGB ?
.........................
You can create one million square matrix [1000x1000]
One million single vector from source has immediate meaning
from Fourier spectrum.
One million XY double vector is for XY plot.
Single Y, double XY imported from source ?
One million matrix [square/rectangular] ... from source ?
Two many unknowns for help !
OneMillion.sm (36,31 КиБ) скачан 1368 раз(а).
OneMillion Rectangular.sm (15,58 КиБ) скачан 1330 раз(а).
Thank you uni and Jean for your answers, now I reviewed my problem. Fortunately I have already installed the 3D Plot Region plugin (99.7030 SM version). I don't know why "plug-in installation failed" last week, but now that problem is solved.
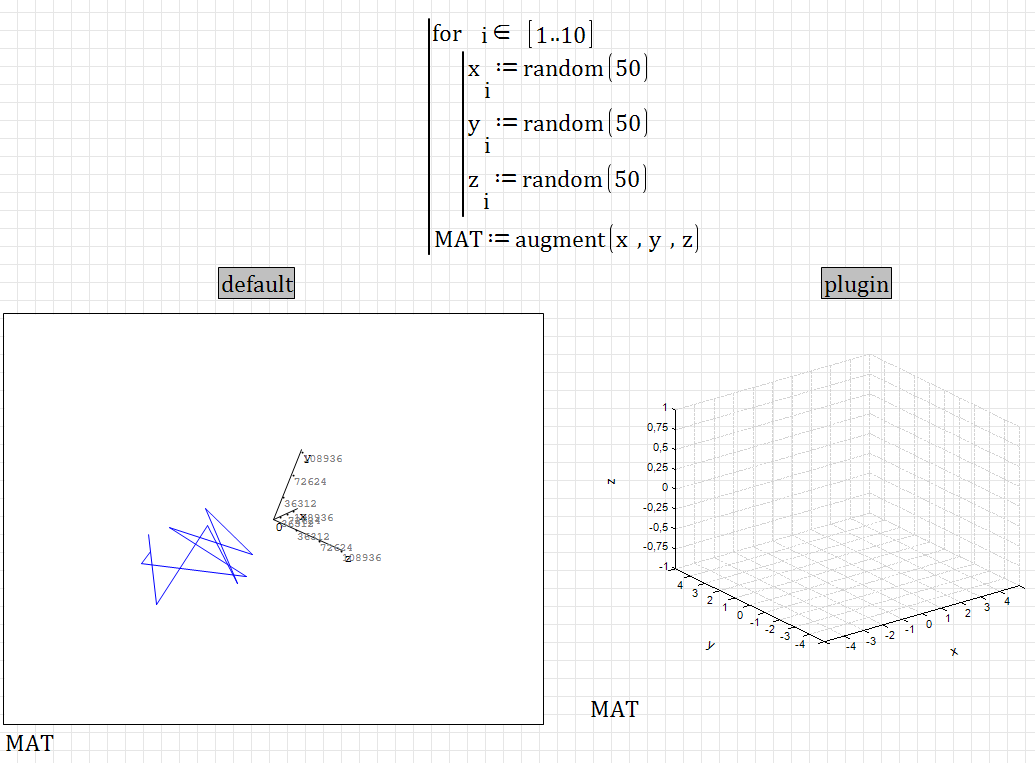
What I understand for the 3D plot region is that you need a function to be plotted, and please correct me if I am wrong. I was reviewing your image creation files Jean, and was very helpful for me to know those functionalities, but in my case, I have a 3D graph more like "scatter plot".
Here, for example, I generate a random matrix 10x3 of ten points in x,y,z coordinates. In the included default 3D plot, it seems that I cannot delete the line between points (I want only the points to be displayed), and also I cannot extend the axis coordinates to verify the coordinates for a point. It looks like the coordinates are reversed, since there is no point plotted in the x+,y+,z+ region (and that region should be the only one with plotted points). Also it seems to be totally out of range because my axis values are around 50000 and I have values no greater than 50.
I hope you can help me, or if you know that I could do this sort of plots in another program but from SMath (I begin to know about Maxima, for instance).
Thank you both again!
SMath:
Mathcad:
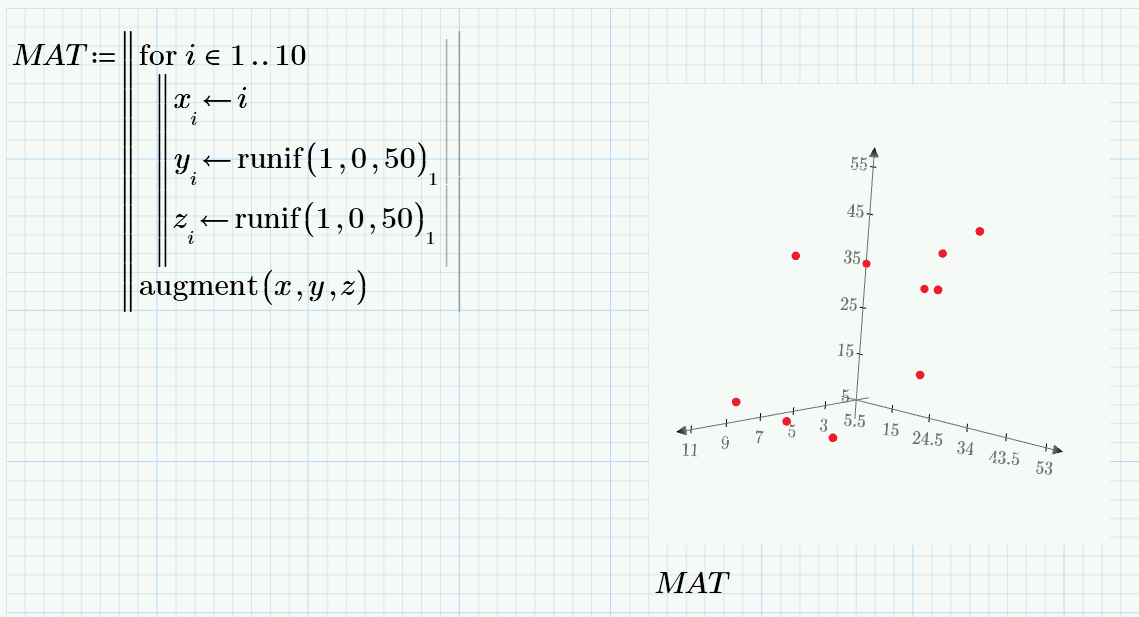
SMath file:
Scatter plot.sm (4,54 КиБ) скачан 1324 раз(а).
(sorry for the too large images, I don't know how to change that)
What I understand for the 3D plot region is that you need a function to be plotted, and please correct me if I am wrong. I was reviewing your image creation files Jean, and was very helpful for me to know those functionalities, but in my case, I have a 3D graph more like "scatter plot".
Here, for example, I generate a random matrix 10x3 of ten points in x,y,z coordinates. In the included default 3D plot, it seems that I cannot delete the line between points (I want only the points to be displayed), and also I cannot extend the axis coordinates to verify the coordinates for a point. It looks like the coordinates are reversed, since there is no point plotted in the x+,y+,z+ region (and that region should be the only one with plotted points). Also it seems to be totally out of range because my axis values are around 50000 and I have values no greater than 50.
I hope you can help me, or if you know that I could do this sort of plots in another program but from SMath (I begin to know about Maxima, for instance).
Thank you both again!
SMath:
Mathcad:
SMath file:
Scatter plot.sm (4,54 КиБ) скачан 1324 раз(а).
(sorry for the too large images, I don't know how to change that)
Now this component cannot be fully used for your purposes. Point visualization is not implemented. I am still looking for time to study the theory of three-dimensional graphics. Unfortunately, the limitations do not allow the use of free components. Writing everything from scratch is a time consuming task.
Russia ☭ forever, Viacheslav N. Mezentsev
1 пользователям понравился этот пост
frapuano 11.05.2020 04:01:00
Ok, thank you very much uni. In the meantime, I will try to somehow export my matrix to Scilab, where I previously worked with 3D scatter plots. Anyways, I am amazed by the other plotting capabilities (right now reading the SMath Einführung).
A big thank you for your plugins.
A big thank you for your plugins.
A three-dimensional image can be displayed on a flat graph
https://en.smath.com/forum/yaf_postsm12626_3D-Plot-Region.aspx#post12626

Scatter plotM.sm (13,56 КиБ) скачан 1361 раз(а).
https://en.smath.com/forum/yaf_postsm12626_3D-Plot-Region.aspx#post12626
Scatter plotM.sm (13,56 КиБ) скачан 1361 раз(а).
1 пользователям понравился этот пост
frapuano 11.05.2020 04:01:00
Thank you Ber7 for recalling your previous post. Awesome 3D animations. I will certainly use this method to convert 3D to 2D and will give a try for animation on my scatter plot.
Inspired from Ber7:
otherwise => scaled/populated/oriented
Not yet done Higgs Boson !!!
Page4 Scatter 3D.sm (19,31 КиБ) скачан 1473 раз(а).
otherwise => scaled/populated/oriented
Not yet done Higgs Boson !!!
Page4 Scatter 3D.sm (19,31 КиБ) скачан 1473 раз(а).
- Новые сообщения
- Нет новых сообщений