3D Plot Region - CreateMesh() and 3D Plot - Сообщения

3D Plot Region


Regions: 3D Plot.
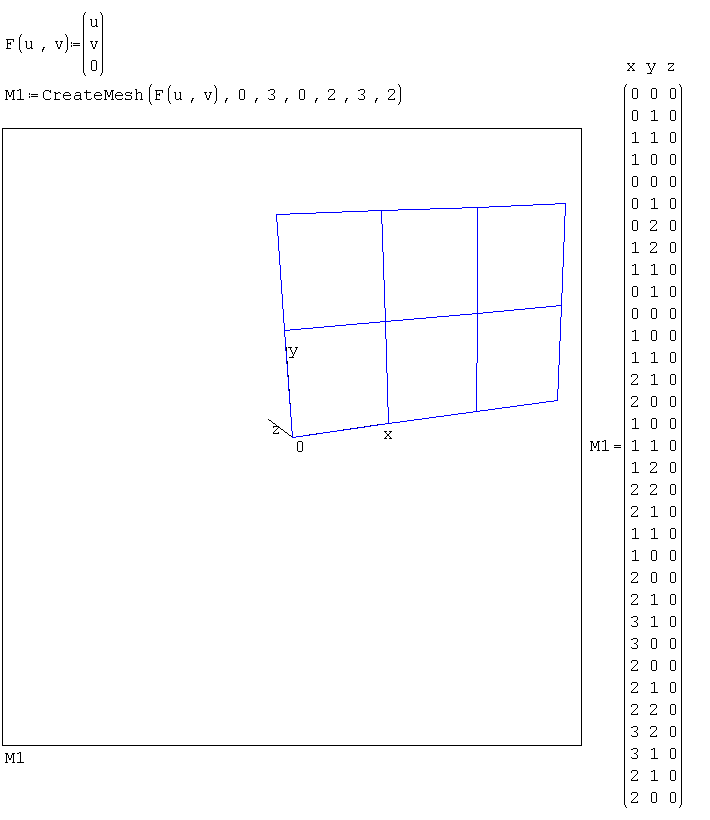
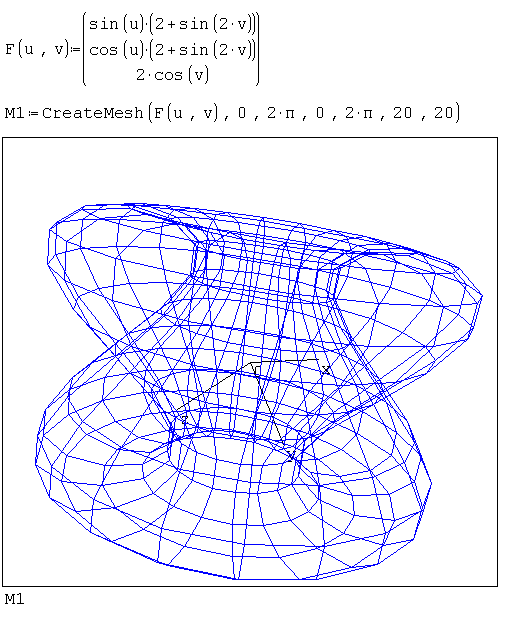
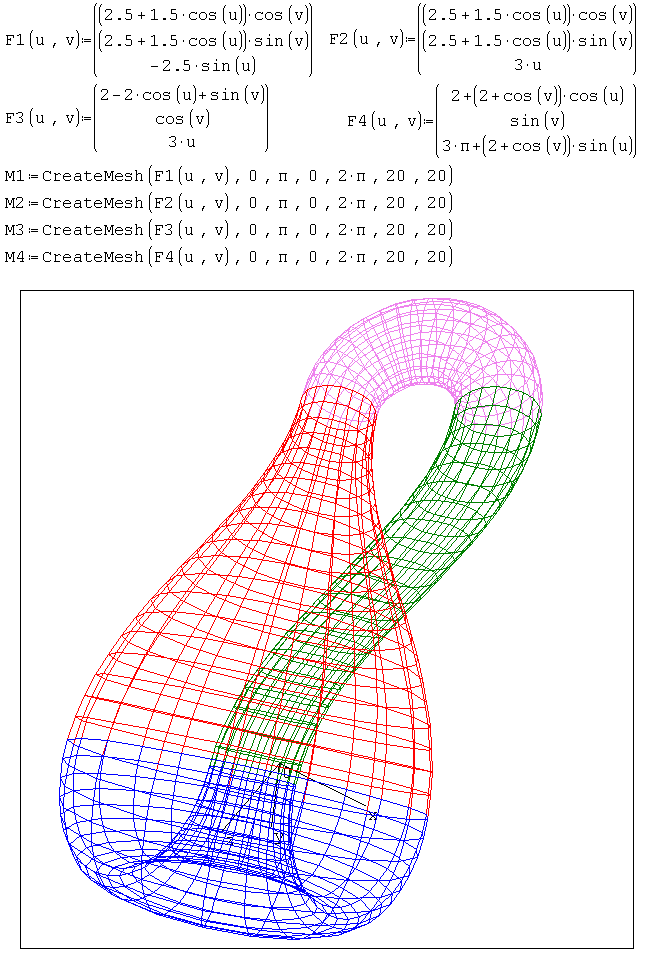
Functions: CreateMesh().
3D Plot. CreateMesh. Examples.zip (190,33 КиБ) скачан 1454 раз(а).
Regions: 3D Plot.
Functions: CreateMesh().
3D Plot. CreateMesh. Examples.zip (190,33 КиБ) скачан 1454 раз(а).
Russia ☭ forever, Viacheslav N. Mezentsev
5 пользователям понравился этот пост
zoom 17.01.2016 17:06:00, Infinity 29.04.2013 03:12:00, Oscar Campo 29.04.2013 10:27:00, Davide Carpi 29.04.2013 11:57:00, Radovan Omorjan 29.04.2013 02:10:00
Looks promising!
In particular I like the right-handedness of the plot.
Issues:
- IsVisible attributes of axesstyle and gridstyle are not responsive.
- strange behaviour if z limits are exceeded by the z-surface. I guess that the surface should be trimmed by the bounding box. Otherwise the axes have to be included in the hidden line algorithm. For now you seem to assume that they are always in the background.
- definition of a function is mandatory. No pure xy-expressions.
Technische Mechanik mit SMath Studio: https://link.springer.com/book/10.1007/978-3-658-50592-9
1 пользователям понравился этот пост
Вячеслав Мезенцев 03.05.2013 16:21:00
Yes, I know about all these problems. They are based on the library that I used. I'm working on that too.
Let's imagine the xy-expression: 1 + x*y + 3*(x-y)+ sin(t0) -> 1 + x[1]*x[2] + 3*(x[1]-x[2])+ sin(t0) or 1 + x[2]*x[1] + 3*(x[2]-x[1])+ sin(t0) ?
Unlike X-Y Plot we have two independent variables. How do I know their order (x,y) or (y,x)? That's why it is not implemented in Mathcad too. I don't want use only x and y variables for that purpose.
Wrote
...
- definition of a function is mandatory. No pure xy-expressions.
Let's imagine the xy-expression: 1 + x*y + 3*(x-y)+ sin(t0) -> 1 + x[1]*x[2] + 3*(x[1]-x[2])+ sin(t0) or 1 + x[2]*x[1] + 3*(x[2]-x[1])+ sin(t0) ?
Unlike X-Y Plot we have two independent variables. How do I know their order (x,y) or (y,x)? That's why it is not implemented in Mathcad too. I don't want use only x and y variables for that purpose.
Russia ☭ forever, Viacheslav N. Mezentsev

325 сообщений из 2 052 понравились и 1 не понравились пользователям.
Группа: Moderator
It seems that you can delete the function name "f" from the placeholder and to put something else. It will keep the previous function and not complaining.
When Sisyphus climbed to the top of a hill, they said: "Wrong boulder!"
WroteI don't want use only x and y variables for that purpose.
OK, clearyl I have to accept and respect your preferences, but I would not mind x and y being used as dummy variables just like in the built in 3D graphics region. That may, of course, be limited to cases, where there is no pure function name given.
Assigning the x-axis to the first and the y-axis to the second argument of the plot function prevents the user from plotting f(y,x) instead of f(x,y). If you want to be free to avoid the look of x and y in the placeholder, then you still can assign x and y to other names. You even could get the names as smart defaults for axis labels.
The freedom in variable choice in the xy-plot is obtained at the price of having to keep these variables unassigned above that plot. Even Davide's Clear won't help (I tried that).
Technische Mechanik mit SMath Studio: https://link.springer.com/book/10.1007/978-3-658-50592-9
I can do this:
1. If you enter a function f(2) then I think it equal to f(x, y)
2. If you enter a function f(1) then I think it equal to f(x[1],x[2]), where x - vector ([x,y]).
3. If you enter a simple expression and it has one undefined variable, then I think it is a vector ([x,y]).
1. If you enter a function f(2) then I think it equal to f(x, y)
2. If you enter a function f(1) then I think it equal to f(x[1],x[2]), where x - vector ([x,y]).
3. If you enter a simple expression and it has one undefined variable, then I think it is a vector ([x,y]).
Russia ☭ forever, Viacheslav N. Mezentsev
Never mind! I shall cope...
Technische Mechanik mit SMath Studio: https://link.springer.com/book/10.1007/978-3-658-50592-9
uni, i don't know if you could take advantage of this code:
http://www.codeproject.com/Articles/42174/High-performance-WPF-3D-Chart
http://www.codeproject.com/Articles/42174/High-performance-WPF-3D-Chart
1 пользователям понравился этот пост
Вячеслав Мезенцев 03.05.2013 19:54:00
Wroteuni, i don't know if you could take advantage of this code:
http://www.codeproject.com/Articles/42174/High-performance-WPF-3D-Chart
Yes, it's interesting, I added to my bookmarks. I have an account on codeproject.
There is another similar things: Plot 3D surfaces.
Russia ☭ forever, Viacheslav N. Mezentsev
Wrote
Yes, it's interesting, I added to my bookmarks. I have an account on codeproject.
There is another similar things: Plot 3D surfaces.
BTW, the author of the book you mentioned in the xyplot thread, has another book about WPF
"Practical WPF Charts and Graphics"
Updated. Function CreateMesh() moved from the Plot3D plugin. Do not use it any more.
Russia ☭ forever, Viacheslav N. Mezentsev
WroteUpdated. Function CreateMesh() moved from the Plot3D plugin. Do not use it any more.
Thanks for the update. I installed the updated version and removed Plot3D.
now the 3DPlotRegion plugin shows up twice in the plugin manager, see attached screenshot.
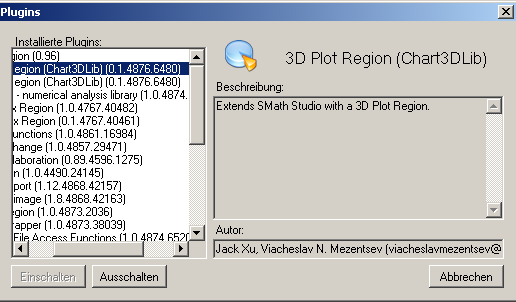
Technische Mechanik mit SMath Studio: https://link.springer.com/book/10.1007/978-3-658-50592-9
WroteWroteUpdated. Function CreateMesh() moved from the Plot3D plugin. Do not use it any more.
Thanks for the update. I installed the updated version and removed Plot3D.
now the 3DPlotRegion plugin shows up twice in the plugin manager, see attached screenshot.
Don't worry, this is normal. Andrey will correct it.
Russia ☭ forever, Viacheslav N. Mezentsev
I mentioned this resource in another thread, VTK.
These are some c# wrappers for VTK :
http://www.vtk.org/Wiki/VTK/CSharp/ActiViz.NET
http://vtkdotnet.sourceforge.net/
http://sourceforge.net/projects/vtknetexamples/
These are some c# wrappers for VTK :
http://www.vtk.org/Wiki/VTK/CSharp/ActiViz.NET
http://vtkdotnet.sourceforge.net/
http://sourceforge.net/projects/vtknetexamples/
1 пользователям понравился этот пост
Вячеслав Мезенцев 09.06.2013 11:19:00
I am using the plugin from the extension manager.
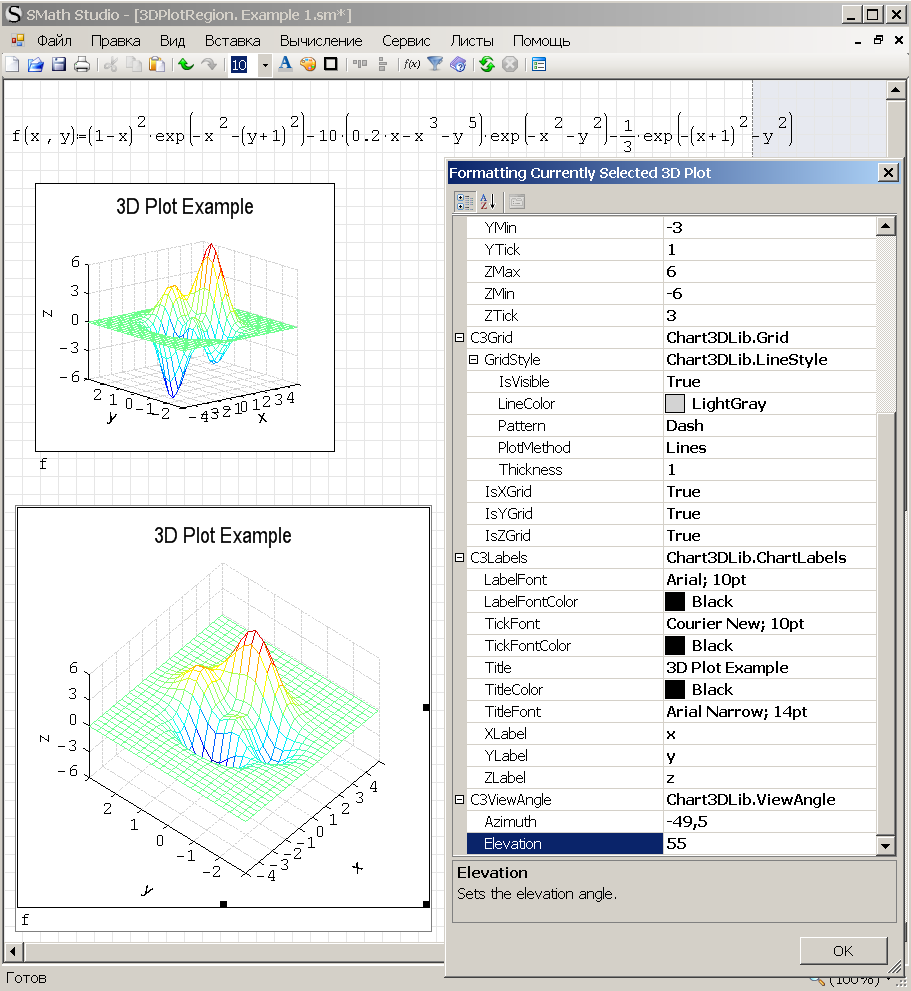
Seems that I can now save the regions, but user settings aren't saved (see attached sheet, where the default settings are not really appropriate).
Is that a local problem or known bug?
Uni, are you going to continue this branch of plotting or do you focus on other ways?
NelderMead.sm (29,83 КиБ) скачан 1800 раз(а).
Technische Mechanik mit SMath Studio: https://link.springer.com/book/10.1007/978-3-658-50592-9
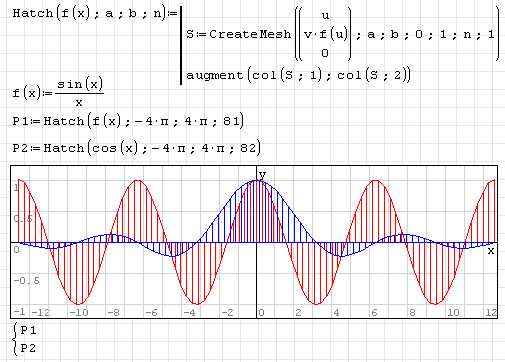
CreateMesh() is useful for 2D plots as well...
Technische Mechanik mit SMath Studio: https://link.springer.com/book/10.1007/978-3-658-50592-9
3 пользователям понравился этот пост
Radovan Omorjan 02.02.2014 02:47:00, Вячеслав Мезенцев 02.02.2014 04:22:00, ruddy 02.10.2025 13:25:26
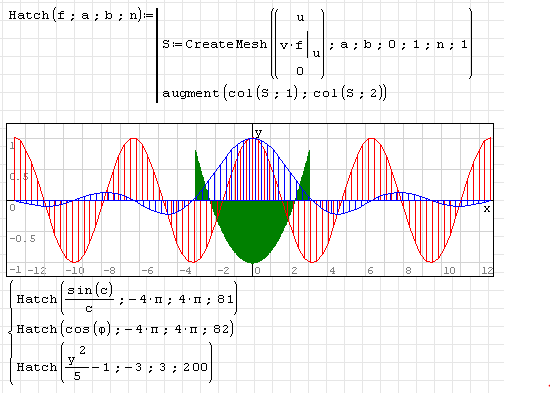
In the previous version, the expression to plot had to be an explicitly defined function. This condition is now relaxed thanks to Davide's FunctionsExtensions plugin. Using the at(expr,var) function, you can substitute values for undefined variables in arbitrary expressions, thus you can use these expressions as if they were functions.
Uni, if you would make CreateMesh() flexible in that it can handle 2- and 3-element vectors, then poking out the submatrix in the 2D case would not be required any more.
Uni, if you would make CreateMesh() flexible in that it can handle 2- and 3-element vectors, then poking out the submatrix in the 2D case would not be required any more.
Technische Mechanik mit SMath Studio: https://link.springer.com/book/10.1007/978-3-658-50592-9
1 пользователям понравился этот пост
ruddy 02.10.2025 18:00:01
The current version (0.1.5161.27307) of the 3DPlot plugin interferes with the clipboard. If pasting any expression from the clipboard to the canvas, I get a 3DPlot region instead. There used to be a similar problem with Hyperlink and Conditionally formatted labels, Davide managed to handle this.
Technische Mechanik mit SMath Studio: https://link.springer.com/book/10.1007/978-3-658-50592-9
Is it possible to use augment(u;v;f) on 3DPlot plugin, like we use on a X-Y Plot plugin? (u;v;f are vectors).
rod_spring.sm (32,11 КиБ) скачан 1769 раз(а).
rod_spring.sm (32,11 КиБ) скачан 1769 раз(а).
- Новые сообщения
- Нет новых сообщений