1 Pages (8 items)
x,y time depended graphs - Messages
WroteIs it possible to draw such a graph.
Yes it is possible.
Here is your request.
Regards
Graphs_1.sm (4.68 KiB) downloaded 1016 time(s).
2 users liked this post

You can get the 3D graph with the Maxima plugin
Scatter plot_Kr(adattato).sm (161.33 KiB) downloaded 1061 time(s).
inspired by the discussion on this forum
full discussion
sergio
Scatter plot_Kr(adattato).sm (161.33 KiB) downloaded 1061 time(s).
inspired by the discussion on this forum
full discussion
sergio
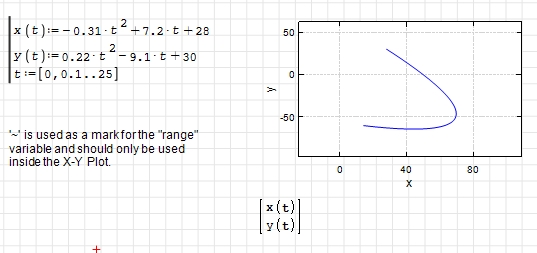
Hi. Just another way, in addition to the solutions offered by Overlord and Pompelmo, using the ability of XYPlot plugin for plot parametric curves, as is explained here.
XYPlot Parametric.sm (5.61 KiB) downloaded 998 time(s).
Best regards.
Alvaro.
XYPlot Parametric.sm (5.61 KiB) downloaded 998 time(s).
Best regards.
Alvaro.
WroteIs it possible to draw such a graph.
... export your creation
Cheers ... Jean.
Utilities XY plot [Butterfly].sm (29.82 KiB) downloaded 892 time(s).
Wroteusing the ability of XYPlot plugin for plot parametric curves
Parametric ability is a good addition.
I wish 2D-Plot has this feature too.
I also would like animation for XY-Plot.
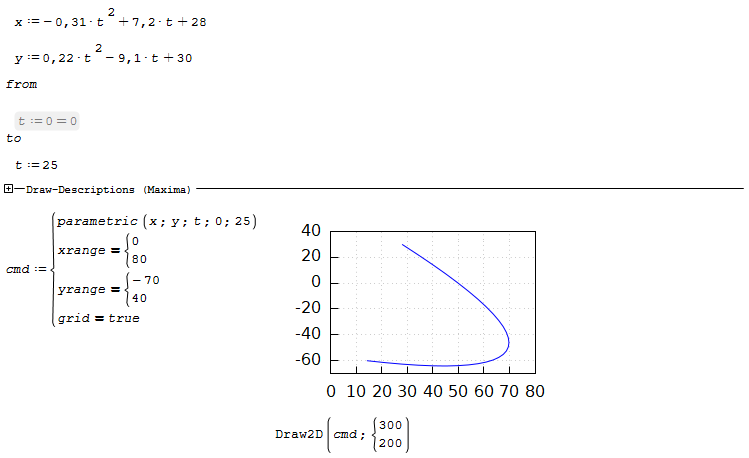
The Maxima plugin provides plotting functions, among them parametric plots. For details look for "kraska smath handbuch".
Note that there seems to be a png export glitch. The region t:=25 is disabled in the sheet but not grayed out in the export (image below). The parameter variable obviously must be undefined, otherwise the x and y expressions are just numbers.
para.sm (137.85 KiB) downloaded 1054 time(s).
Note that there seems to be a png export glitch. The region t:=25 is disabled in the sheet but not grayed out in the export (image below). The parameter variable obviously must be undefined, otherwise the x and y expressions are just numbers.
para.sm (137.85 KiB) downloaded 1054 time(s).
Technische Mechanik mit SMath Studio: https://link.springer.com/book/10.1007/978-3-658-50592-9
I have no recollection of Parametric Engineering project(s).
Whatever, this document advances your Parametric Journey.
Ultimately, export the project as a standard data table for publishing.
... offered up to the derivatives of the piece-wise project.
Comments, more help ... Welcome.
Cheers ... Jean.
Utilities XY plot Parametric.sm (89.13 KiB) downloaded 1005 time(s).
1 Pages (8 items)
- New Posts
- No New Posts