
3D Plot Region (Chart3DLib) - Problem with saving formatted plots - 消息

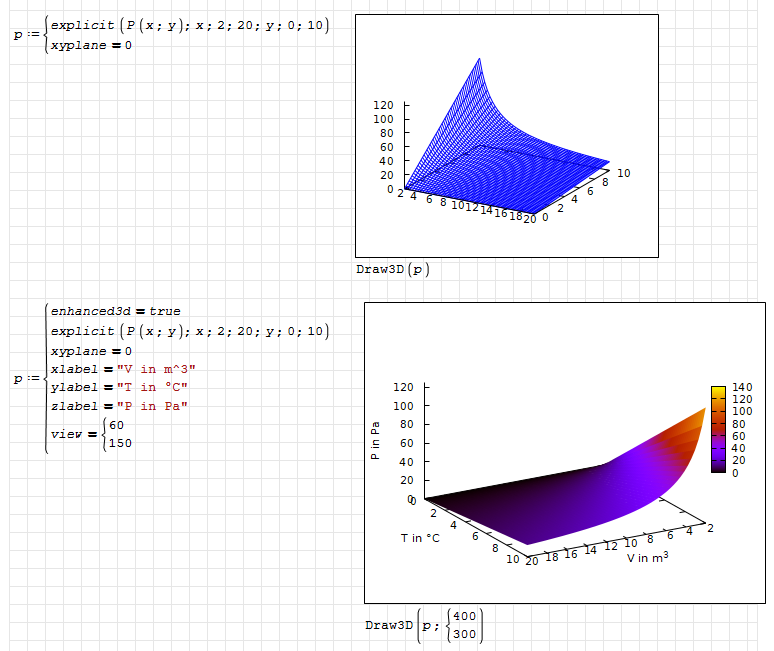
For my Physical Chemistry lectures I am adopting MathCAD 8th sheets attached to the Atkins and de Paula, 7th edition textbook, to the recent SMath Studio. For 3D plots I am applying plugin "3D Plot Region (Chart3DLib)" it works good except saving formatted plots. Have you got any idea how to resolve the problem.
The SMath sheet and PDF screen attached.
Yours
Dariusz.
未找到文件。未找到文件。
P701E02_Kr.sm (224.5 KiB)已下载 1663 次。
Now I have to overcome the "no maxima.bat" problem.
 .
Your solution allows rotation of the plot?
Dariusz
The given solution controls the orientation by the view parameters.
Yet there is a so called Maxima Draw3D region, where interactive rotation is possible, at the price of slightly less stability (the region might freeze).
WroteNow I have to overcome the "no maxima.bat" problem. .
Your solution allows rotation of the plot?
You can do it much differently and more profitable:
1. Tabulate a 10 x 10 xy matrix [per say]
2. Install the spline 2D
3. Mesh finer CreateMesh.
4. Orient at will.
5. Plot the 2D oriented.
The bonus is that you can spline/interpolate the original matrix.
The lectures I have for biology students, which are mathematically impaired (excluding statistics, which they learn but hate). Therefore I would like for them simplest possible solution, with "crude" SMath.
Yours,
Dariusz
Plot2DAs3D.sm (27.73 KiB)已下载 1634 次。
Plot2DAs3D.pdf (126.78 KiB)已下载 1000 次。
Best regards.
Alvaro.
WroteHi! Maxima works after installaton of the last, 64-bit version.
The lectures I have for biology students, which are mathematically impaired (excluding statistics, which they learn but hate). Therefore I would like for them simplest possible solution, with "crude" SMath.
Yours,
Dariusz
Then the simplest is in native Smath ... ignoring Maxima.
In the attached: spline(x,y,M) is same as bilinear(x,y,M)
spline(x,y,M) adapted from Valery Ochov [MCD]
Spline Matrix Tutorial RECTANGULAR Surface Plot.sm (22.98 KiB)已下载 1667 次。
SplineRectangularMatrix1 Rotate XYZ.sm (54.8 KiB)已下载 1644 次。
Bilinear [Oterwise metric X, Y Directions].sm (77.31 KiB)已下载 1412 次。
WroteHi. You can adapt this technique to preserve the orientation in the 3D plot or plot the projection of a 3D surface into a 2D plot, both native SMath plots. The original idea isn't mine, but can't find from who I adapt it.
Alvaro,perhaps you got this idea from here
https://en.smath.com/forum/yaf_postst2215_Transferring-three-dimensional-image-on-a-two-dimensional--graph.aspx
WroteWroteHi. You can adapt this technique to preserve the orientation in the 3D plot or plot the projection of a 3D surface into a 2D plot, both native SMath plots. The original idea isn't mine, but can't find from who I adapt it.
Alvaro,perhaps you got this idea from here
https://en.smath.com/forum/yaf_postst2215_Transferring-three-dimensional-image-on-a-two-dimensional--graph.aspx
Hi Fridel. Sure from you, but not from this post, which involve very complicate figures. I remember that I ask from another post (I assume now to you) from where you get that gamma factor for rotate the matrix to plot, because have troubles reconstructing it. In spanish literature spherical coordinates and Euler angles are not always the same than in english, and given that SMath 3D plots are left oriented ... with this two issues I have enough. BTW the idea for multiply with a "point of view" matrix it's great and works for make 3D plots in native SMath 2D plot region, or preserve the orientation in 3D. I remember also another post, guess from Jean, with other matrices expressing very simple rotations with integers as coefficients.
Best regards.
Alvaro.
WroteFor 3D plots I am applyingplugin "3D Plot Region (Chart3DLi" it works good except saving formatted plots. Have you got any idea how to resolve the problem.
Considered a bug, reported, never solved ... plugin as is
can't mesh, does not save setting => useless.
Practice the attached.
Page2 Unk.sm (36.64 KiB)已下载 1927 次。
Wrote...
Hi Fridel. Sure from you, but not from this post, which involve very complicate figures. I remember that I ask from another post (I assume now to you) from where you get that gamma factor for rotate the matrix to plot, because have troubles reconstructing it.
...
Found it.
Here: https://en.smath.com/forum/yaf_postst14918_3D-Rotation-Matrix.aspx
and here: https://en.smath.com/forum/yaf_postsm54527_AlgLib-3-1x.aspx#post54527
Best regards.
Alvaro.
Wrotefrom where you get that gamma factor for rotate the matrix to plot, because have troubles reconstructing it.
That gamma factor is the Euler [roll, pitch, yaw] NOT commutative,
otherwise: couldn't pilot aircraft !!!
The MeshPlot(T(u,v),0,2*π,35,0,2*π,35) is CreateMesh(,,,,,,,) since at least SS 5346
The attached is Alvaro document optimized SS 6179
Once optimized, it runs ~ 10 times faster but twice timing than CreateMesh.
There are 4 common rotations:
1. Quaternions,
2. Parametric 'X,Y,Z,t'
3. Euler
4. Composite
If you want those demo sheets: say YES.
Cheers, thanks alvaro ... Jean
Utilities Matrix CreateMesh Code [Alvaro].sm (42.07 KiB)已下载 1443 次。
- 有新帖
- 无新帖