X-Y Plot Region - Extends SMath Studio with a X-Y Plot Region. - Сообщения
WroteUpdated. Axis general format changed.
Hi uni, did you have the chance to test the new update also on Smath Viewer?
In case yes, if you could let us know so that users that are currently interested in Viewer compatibility (like me) can update safely.
Thanks


325 сообщений из 2 052 понравились и 1 не понравились пользователям.
Группа: Moderator
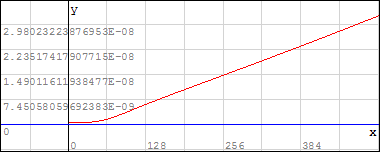
At some higher power, say after 10,11 (it depends on the plot size - larger the plot smaller the power) it just become white and the regions disappear when you click on them. It seems it got stuck. But you can click on the power and reduce it. When you reduce it, regions got back and everything seems to be Ok.
Regards,
Radovan

WroteHi uni, did you have the chance to test the new update also on Smath Viewer?
In case yes, if you could let us know so that users that are currently interested in Viewer compatibility (like me) can update safely.
Thanks
Nope, the issue is still here and it is related to Xml serialization used in the plugin. I'm looking for possible fixes.

WroteAt some higher power, say after 10,11 (it depends on the plot size - larger the plot smaller the power) it just become white and the regions disappear when you click on them. It seems it got stuck. But you can click on the power and reduce it. When you reduce it, regions got back and everything seems to be Ok.
Radovan, this is normal. This is due to errors in drawing. Similar behavior is found in another plugin, but there is a workaround.
ЦитатаThis method just handles the case where one or more of the coordinates are outrageous,
or GDI+ threw an exception. This method attempts to correct the outrageous coordinates by
interpolating them to a point (along the original line) that lies at the edge of the ChartRect
so that GDI+ will handle it properly. GDI+ will throw an exception, or just plot the data
incorrectly if the coordinates are too large (empirically, this appears to be when the
coordinate value is greater than 5,000,000 or less than -5,000,000). Although you typically
would not see coordinates like this, if you repeatedly zoom in on a ZedGraphControl, eventually
all your points will be way outside the bounds of the plot.
I'll try to workaround the problem in the same way.
And the trick is to set the X, Y ranges before putting the plot argument(s).
Too large/too small numbers aren't visible anyway, better manage otherwise.
WroteAt some higher power, say after 10,11 (it depends on the plot size - larger the plot smaller the power) it just become white and the regions disappear when you click on them. It seems it got stuck. But you can click on the power and reduce it. When you reduce it, regions got back and everything seems to be Ok.
Updated. Try now.
325 сообщений из 2 052 понравились и 1 не понравились пользователям.
Группа: Moderator
WroteWroteAt some higher power, say after 10,11 (it depends on the plot size - larger the plot smaller the power) it just become white and the regions disappear when you click on them. It seems it got stuck. But you can click on the power and reduce it. When you reduce it, regions got back and everything seems to be Ok.
Updated. Try now.
Thank you uni. It does not stuck anymore. I just thought it might be inconvenient the way it worked before. White area instead of the plot and disappearing regions is not pleasant to see.
Regards,
Radovan
WroteNope, the issue is still here and it is related to Xml serialization used in the plugin. I'm looking for possible fixes.
Fix committed to the SVN server. Error messages about missing LINQ and XmlSerializer assemblies shouldn't be a problem anymore.
P.S. Before changes applies plugin must be recompiled and published again by [userlink]uni[/userlink]
WroteIs it possible to plot text at a specified coordinate in X-Y Plot Region or ZedGraph Plot?
Updated. Text labels added.
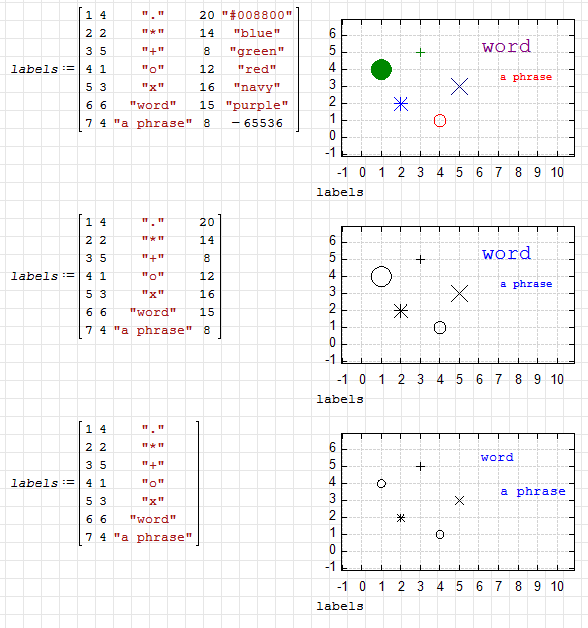

1. Only integer values for x & y coordinates effective. Text Lables disappear when decimal values are used.
2. Changes in formatting of lines to spline not saved when worksheet is re-loaded.
Trace settings can also be used with text labels (in mixed mode). The text label settings are used if specified, otherwise the trace settings are used.
WroteUpdated. Try now.
While you are in the plot design, is there any chance to improve Quick plot ?
Damned hard to leave with so many useless decimals.
Obviously, it concerns x_axis as well
WroteUpdated. Try now.
Trace settings can also be used with text labels (in mixed mode). The text label settings are used if specified, otherwise the trace settings are used.
Thanks. It works fine now.
- Новые сообщения
- Нет новых сообщений