X-Y Plot Region - Extends SMath Studio with a X-Y Plot Region. - Сообщения
Just one observation:
Changes to the placeholder entries do trigger a vertex update when the region is left, whereas zoom operations or change of number of points don't.
In such cases, the plot is only updated after re-calculation of the whole sheet.
Even better would be a vertex update after each operation (without need to leave the region or the settings dialog), just as it works with the update of the plot attributes.
EDIT: Actually this is SS-2404
General symbolic expressions don't seem to be allowed.
Aren't the expressions simplified before generating the plots?
Here an example which I don't understand:
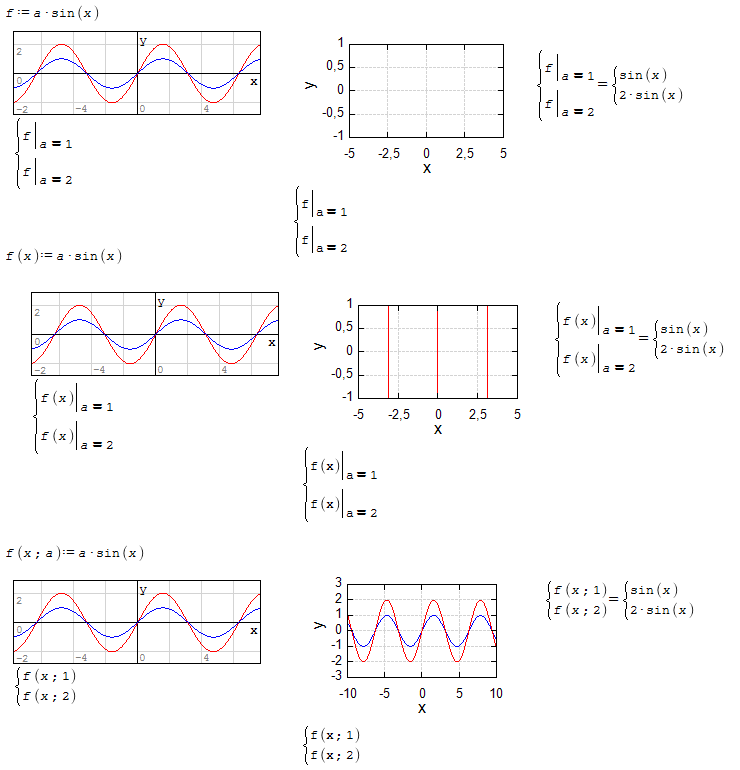
xyplotbug3.sm (14,65 КиБ) скачан 1295 раз(а).
Best regards.
Alvaro.
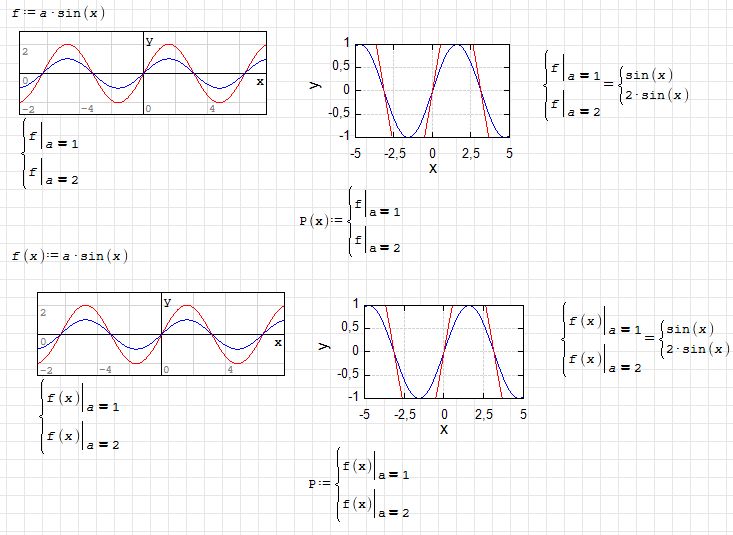
WroteHi mkraska. Here a workaround, which seems that force the evaluation.
Best regards.
Alvaro.
Thanks a lot. It seems that in both cases, an assignment to a simple variable is sufficient (no function with parameter x required).
- Remove spurious lines from function graphs (at singularities) (SS-3553)
- Optional axes cross (SS-3554)
- More consistent default settings for font size (SS-3555)
WroteHi mkraska. Here a workaround, which seems that force the evaluation.
Best regards.
Alvaro.
Tanks Alvaro.
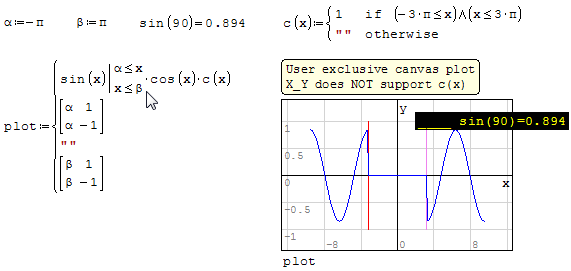
The exclusive argument does not support vectorize operator.
X_Y Plot wisely at(2).sm (16,93 КиБ) скачан 1215 раз(а).
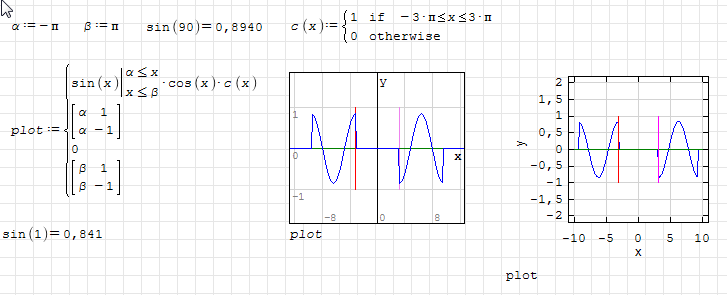
It doesn't accept empty strings as empty plot objects. Is there an official way to specify an empty object? As a workaround, a constant number outside the y range will do. The example below uses 0, which adds a green line y=0.
Accepting "" as empty object would increase compatibility with the built-in 2D plot.
xyplot2.sm (18,86 КиБ) скачан 1262 раз(а).
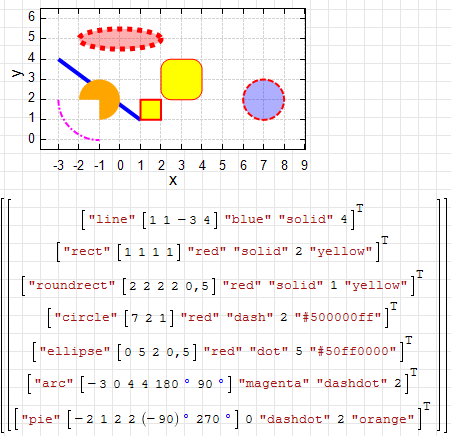
- Suppression of the outline can be done by setting the color to 0. It would be more natural to do it by setting the line width to 0 (which doesn't work) or to set the line style to "none" (which doesn't work either).
- The reference point of arc and pie objects is the lower left corner of the full circle bounding box. It would be more natural to use the center as reference point, just as with circle and ellipse objects.
xyplot.sm (200,14 КиБ) скачан 1334 раз(а).

WroteI need some help as to what the restrictions for plottable expressions are.
General symbolic expressions don't seem to be allowed.
Aren't the expressions simplified before generating the plots?
X-Y Plot nothing know about at() function. Region tries to parse the expression in the placeholder as is and without simplification. So it trying to draw at() function but not f(x). I'll try to add support for at().
WroteWroteI need some help as to what the restrictions for plottable expressions are.
General symbolic expressions don't seem to be allowed.
Aren't the expressions simplified before generating the plots?
X-Y Plot nothing know about at() function. Region tries to parse the expression in the placeholder as is and without simplification. So it trying to draw at() function but not f(x). I'll try to add support for at().
Hi uni,
I hope you enjoyed the mountains.
Earlier in this thread it was proposed to just assign the list of plot objects to a dummy variable in case of evaluation problems.
I found this being quite robust. Many problems are solved this way.
This makes me thinking that a generic solution inside the plugin should exist (without adding support on a case by case base).
How about taking the list, add a dummy (hidden) variable with the preprocessed list to the context and then start over doing plotting stuff.
I may be wrong but eventually it is worth a try.
WroteI hope you enjoyed the mountains.
It was a sporting journey (7 members) with special training and tools. Hard, dangerous, but interesting. In Russia there remained a system of sports tourism (from the USSR). Teams from different regions compete in the passage of various mountain routes.
As for using "a case by case base". I reworked the parsing algorithm to support all features and made it more or less understandable. Preprocessing not uses when parsing because of information about the structure of the expression is lost. Without parsing is too hard to support all features. But time to time I'm trying to make all these things more simple.
- default font sizes reduced (SS-3555);
- added support for the at() function as a simple expression (#303);
- empty objects ( "" ) added (#308);
- changed points format for arc and pie shapes (#309);
- line width for shapes can be zero and color can be "none" (#309).
![2018-09-27 15_16_34-SMath Studio 0.99.6839 - [Section 2D plots XY Plot Plugin.sm].png](/ru-RU/files/Download/WRVRs6/2018-09-27-15_16_34-SMath-Studio-0.99.6839---[Section-2D-plots-XY-Plot-Plugin.sm].png)
Section 2D plots XY Plot Plugin.sm (123,36 КиБ) скачан 1288 раз(а).
WroteList of changes (between 0.99.6823 and 0.99.6839 versions)
Corrections
- Matrix transpose fixed for nested matrices;
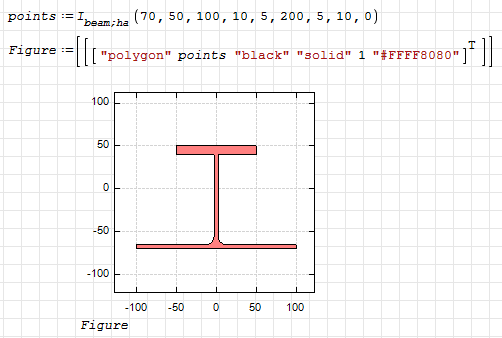
You need to transpose points vector (Transpose bug).
WroteWroteList of changes (between 0.99.6823 and 0.99.6839 versions)
Corrections
- Matrix transpose fixed for nested matrices;
You need to transpose points vector (Transpose bug).
May be a matter of taste, but why not using linear indexing for picking numbers from the dimensions argument? This would have prevented the issue and the argument list clearly looks better without transpose operator. This applies to the whole object as well as to the second argument.
You then wouldn't need even a single transpose operator in the above example.
The less picky the functions are, the better is the user experience.
In the case of polygons and the like I see that you need some convention and it is good to stick to the one used in generic 2-column matrix plotting.
- Smoothing property removed;
- AntiAlias property added for line and symbol style;
- issue with the reversed limits of the axis is fixed;
- refactored.
1. In the second plot only one ellipse is drawn.
2. If the first plot is deactivated, the second plot fails completely
3. Again I had to use a dummy assignment to enforce context substitution
![2018-10-03 21_28_22-SMath Studio 0.99.6839 - [Example NewtonRaphson2.sm_].png](/ru-RU/files/Download/oneTCu/2018-10-03-21_28_22-SMath-Studio-0.99.6839---[Example-NewtonRaphson2.sm_].png)
Example NewtonRaphson2.sm (36,15 КиБ) скачан 1240 раз(а).
- Новые сообщения
- Нет новых сообщений