X-Y Plot Region - Extends SMath Studio with a X-Y Plot Region. - Messages
#321 Posted: 10/3/2018 8:17:19 PM

Updated.
- fixed an issue related to wrong plot method setting;
- refactored.
Try now.
- fixed an issue related to wrong plot method setting;
- refactored.
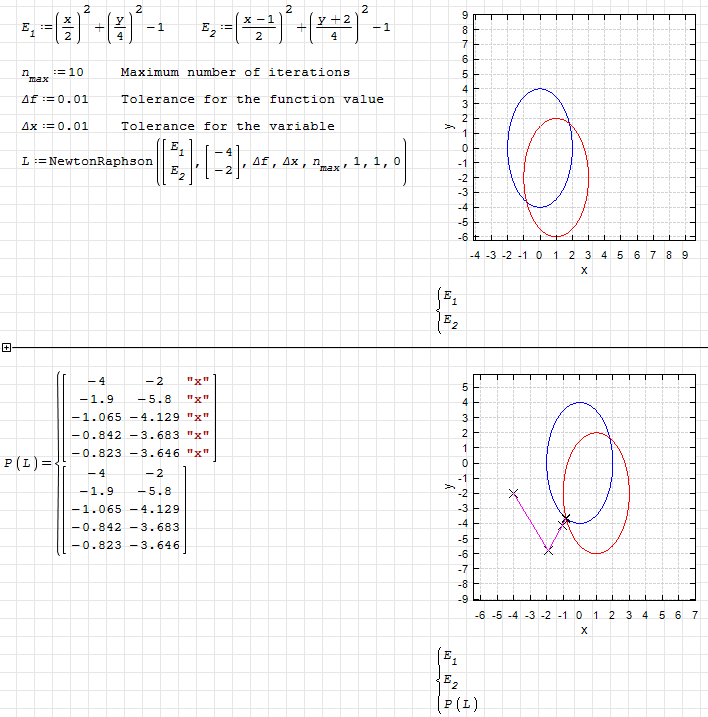
WroteHere is an example with strange behaviour of XY-plot.
1. In the second plot only one ellipse is drawn.
2. If the first plot is deactivated, the second plot fails completely
Try now.
Russia ☭ forever, Viacheslav N. Mezentsev
#322 Posted: 12/3/2018 7:14:20 AM
Hi Uni, is there a plugin setting to plot a graph with logaritmich grid/axis instead of linear grid?
Thanks, bye
Federico
ps: just a curiosity for the moment, I don't need this feature for an upcoming smath project right now..
Thanks, bye
Federico
ps: just a curiosity for the moment, I don't need this feature for an upcoming smath project right now..
#323 Posted: 12/3/2018 8:33:58 AM
Wroteis there a plugin setting to plot a graph with logaritmich grid/axis instead of linear grid?
Zgraph has either/both logscale plot.
If you don't have it installed: once you open the attached, it should be there for you.
2D Plot Stem log10 DECADES Bode.sm (169.47 KiB) downloaded 1314 time(s).
#324 Posted: 12/3/2018 10:42:48 AM
It is planning to add log scale and some other stuff to the plugin. The storage format will be changed. This is a big change and I need time to save the existing functionality.
Russia ☭ forever, Viacheslav N. Mezentsev
#325 Posted: 12/6/2018 1:19:28 PM
Updated. Small changes:
- fixed issue with at() function;
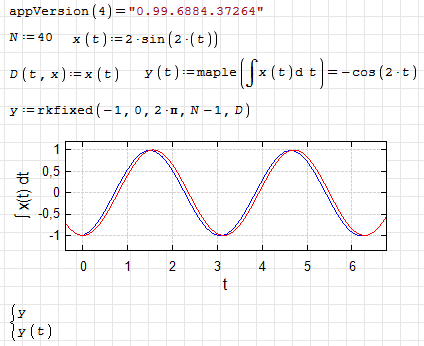
- now identifiers with same name (y and y(t)) works right independently of position in the document.
- fixed issue with at() function;
- now identifiers with same name (y and y(t)) works right independently of position in the document.
Russia ☭ forever, Viacheslav N. Mezentsev
3 users liked this post
#326 Posted: 12/21/2018 3:51:15 PM
Russia ☭ forever, Viacheslav N. Mezentsev
#327 Posted: 3/22/2019 1:55:07 PM
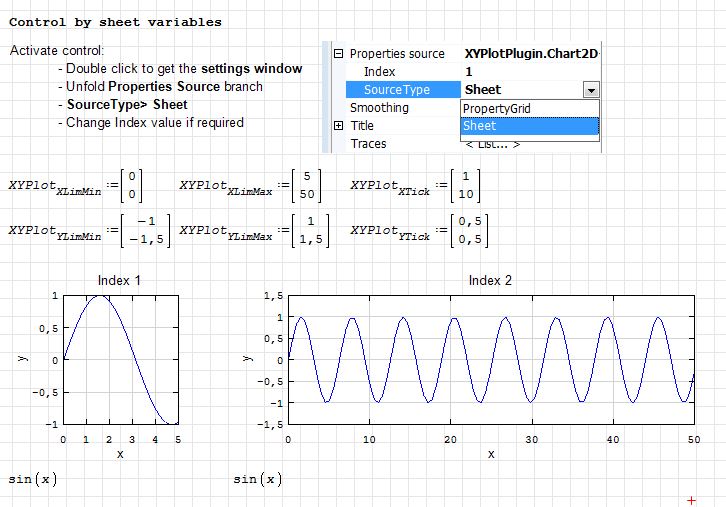
Hi, is there an additional parameter that can control Y2 axis YLimMin, YLimMax, YTick, similarly to Y axis and X axis parameters displayed in image (taken from Mkraska's guide to Smath)
?
Thanks, bye!
?
Thanks, bye!
#328 Posted: 3/23/2019 12:28:08 PM
No. In the future I plan to add the ability to add limits directly on the plot or in the properties window. This requires research to make it convenient.
Unfortunately, there are not many programmers who want to join the project. It is difficult to maintain a large number of plugins alone. My knowledge of English is not enough to teach someone to program. There are many ideas on how to improve plugins, but there is no time to do this.
Unfortunately, there are not many programmers who want to join the project. It is difficult to maintain a large number of plugins alone. My knowledge of English is not enough to teach someone to program. There are many ideas on how to improve plugins, but there is no time to do this.
Russia ☭ forever, Viacheslav N. Mezentsev
#329 Posted: 3/23/2019 2:49:07 PM
Thanks for the feedback Uni.
Just to clarify the reason of my previous question, I'm using YlimMin etc... to set limits of a graph via formulae as elemento of the control vectors.
Something of an indirect way to auto-resize graphs based on the dataset (which is something that is not available otherwise, as far as I know..).
Yesterday I had a graph with data on Y2, so it happens that the graph will resize accordingly to the data of the traces related to Y axis, not to the traces that use Y2 to display the values.
But anyway, not a big problem, I can simply create an additional graph for the trace that was on Y2, and display it on its own on Y, with all the auto-resize features.
In my opinion, the current approach with global variables is super-convenient! I would keep it for sure, and in those case were it is not needed for a project, the current controls in the graph setting window are perfect.
Thanks also for all efforts and dedication to the project..
Just to clarify the reason of my previous question, I'm using YlimMin etc... to set limits of a graph via formulae as elemento of the control vectors.
Something of an indirect way to auto-resize graphs based on the dataset (which is something that is not available otherwise, as far as I know..).
Yesterday I had a graph with data on Y2, so it happens that the graph will resize accordingly to the data of the traces related to Y axis, not to the traces that use Y2 to display the values.
But anyway, not a big problem, I can simply create an additional graph for the trace that was on Y2, and display it on its own on Y, with all the auto-resize features.
QuoteIn the future I plan to add the ability to add limits directly on the plot or in the properties window. This requires research to make it convenient.
In my opinion, the current approach with global variables is super-convenient! I would keep it for sure, and in those case were it is not needed for a project, the current controls in the graph setting window are perfect.
Thanks also for all efforts and dedication to the project..
#330 Posted: 3/23/2019 3:47:11 PM
WroteSomething of an indirect way to auto-resize graphs based on the dataset
... like OriginLab the almost unique software used in Pharmacokinetics.
Hperfine traces, same as Smath "Plot splines".
OriginLab and Smath are the finest trace plotters as they evaluate on pixels.
Maybe I don't understand why you want more than the best already in hand.
OK, Mathcad 11 and earlier was auto-scale in 4 clicks, but what crappy plots !
Your word to me was data set.
#331 Posted: 7/26/2019 8:57:20 AM
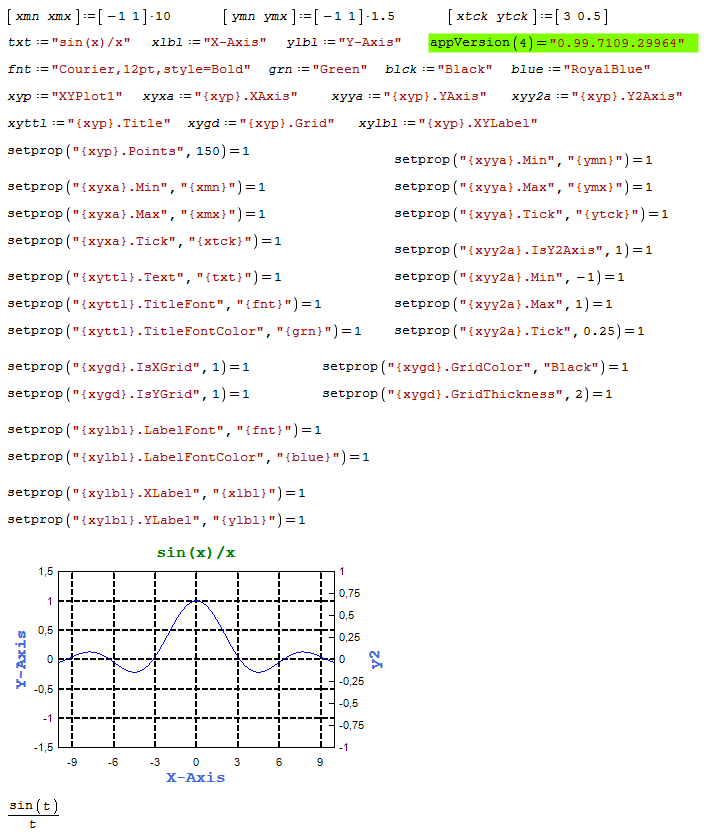
Hi. A small utility for configuring the XYPlot options.
XYPlotOptions.sm (105.51 KiB) downloaded 1341 time(s).
Best regards.
Alvaro.
XYPlotOptions.sm (105.51 KiB) downloaded 1341 time(s).
Best regards.
Alvaro.
5 users liked this post
Arie 7/26/2019 10:10:00 AM, Вячеслав Мезенцев 7/26/2019 10:17:00 AM, Fridel Selitsky 7/26/2019 12:22:00 PM, NDTM Amarasekera 7/26/2019 11:13:00 AM, sergio 7/26/2019 10:31:00 AM
#332 Posted: 8/7/2019 3:14:57 PM
Updated (beta).
Changes:
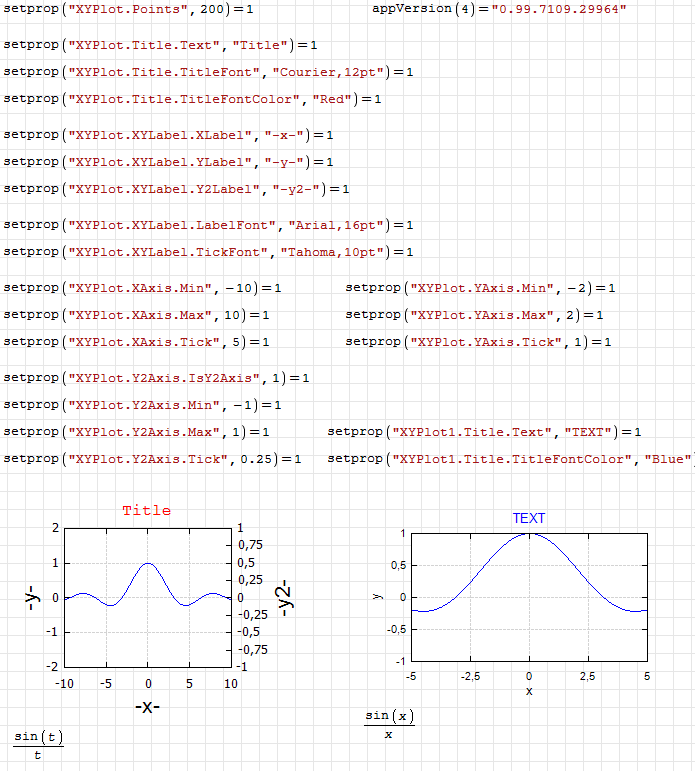
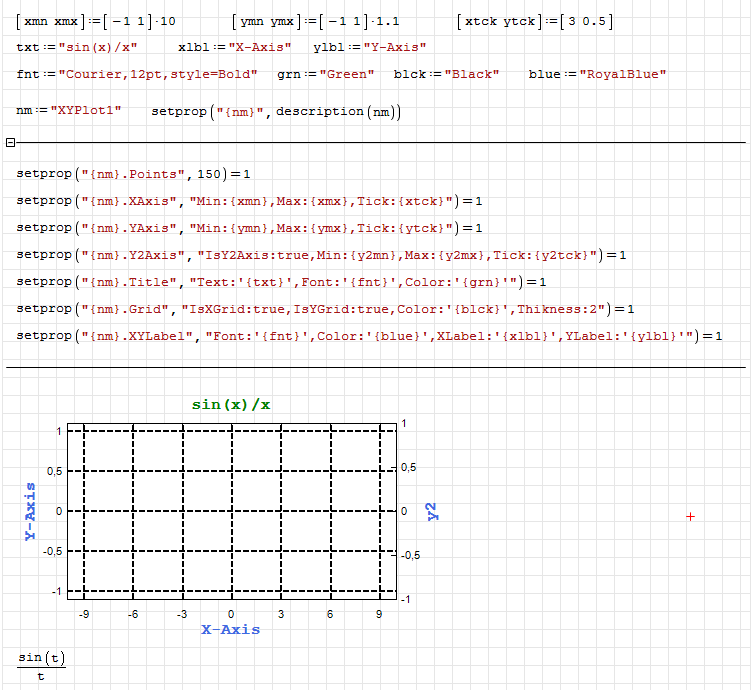
- setprop() an experimental function added;
- 'Name' property added.
Now you can change some set of properties using 'Name'.
Russia ☭ forever, Viacheslav N. Mezentsev
5 users liked this post
Arie 8/7/2019 3:17:00 PM, NDTM Amarasekera 8/7/2019 3:57:00 PM, frapuano 8/7/2019 6:16:00 PM, sergio 8/8/2019 11:05:00 AM, AntonyMos 4/3/2026 4:42:53 PM
#333 Posted: 8/8/2019 10:47:56 AM
Updated (beta).
Changes:
- added ability to include variables for setprop();
- refactored.
More complex but still not so elegant. Unfortunately, property names do not match them in the property editor. These names are for the original classes. In the property editor they are shortened for convenience.
Russia ☭ forever, Viacheslav N. Mezentsev
4 users liked this post
NDTM Amarasekera 8/8/2019 11:27:00 AM, Arie 8/8/2019 11:24:00 AM, frapuano 8/8/2019 1:48:00 PM, sergio 8/8/2019 11:04:00 AM
#334 Posted: 8/20/2019 11:13:24 AM
Updated.
Changes:
- added Style property for chart;
- added Hidden property for axes;
- added auto calculation for ticks.
Changes:
- added Style property for chart;
- added Hidden property for axes;
- added auto calculation for ticks.
Russia ☭ forever, Viacheslav N. Mezentsev
4 users liked this post
frapuano 8/20/2019 12:39:00 PM, Arie 8/20/2019 5:59:00 PM, NDTM Amarasekera 8/20/2019 1:04:00 PM, sergio 8/20/2019 12:09:00 PM
#335 Posted: 8/20/2019 3:51:26 PM
20.08.2019 21:39:25 [INFO ] [Plugin.Initialize()] OS: Microsoft Windows NT 6.2.9200.0
20.08.2019 21:39:25 [INFO ] [Plugin.Initialize()] .Net: 4.0.30319.42000
20.08.2019 21:39:25 [INFO ] [Plugin.Initialize()] 64-bit
20.08.2019 21:39:25 [INFO ] [Plugin.Initialize()] X-Y Plot Region (JXCharts), version 0.2.7171.30885, 20-Aug-2019 17:09:30
20.08.2019 21:39:25 [INFO ] [Plugin.Initialize()] setprop(2) - set value of property.
20.08.2019 21:39:25 [INFO ] [Plugin.Initialize()] Successfully. 1 function(s) loaded.
When I open an SMath file, doesn't matter if it contains XYRegion or not, a log file named XYPlotRegion.log occurs where the sm file located.
It is automatically deleted after Smath is closed.
The log file doesn't created if I directly open SMath.
Should I see this log file, is it necessary to be created, why it has been created first of all?
Regards
1 users liked this post
Вячеслав Мезенцев 8/20/2019 4:15:00 PM
#336 Posted: 8/20/2019 4:21:41 PM
Updated.
Changes:
- log file location changed.
Almost all my extensions create a log file in the place of their installation. In this case, the log file appeared along with the setprop() function. Extensions with components usually do not have a log file. You should not see it next to the document. It is needed for feedback with the developer in case of errors and contains the necessary information about the extension.
Later I will add a parameter to the configuration file (XYPlotPlugin.config), which will be responsible for creating this file.
Russia ☭ forever, Viacheslav N. Mezentsev
#337 Posted: 8/20/2019 4:40:26 PM
As for the setprop() function, I try to get this short form. I have code for this, but I have not yet decided how this will be useful.
Russia ☭ forever, Viacheslav N. Mezentsev
1 users liked this post
Arie 8/20/2019 5:59:00 PM
#338 Posted: 8/20/2019 5:31:15 PM
For what it's worth, I'm working on writing some wrapper functions that I plan to use in a snippet to hopefully ease the use of some of the set prop functions.
I think I just have labels left to complete.
There are some other classes that I made functions for that work such as DecimalPlaces. And some that do not such as GridPattern and NumberFormat. Not sure if they're very useful or not.
EDIT: Updated .sm with some fixes and label functions.
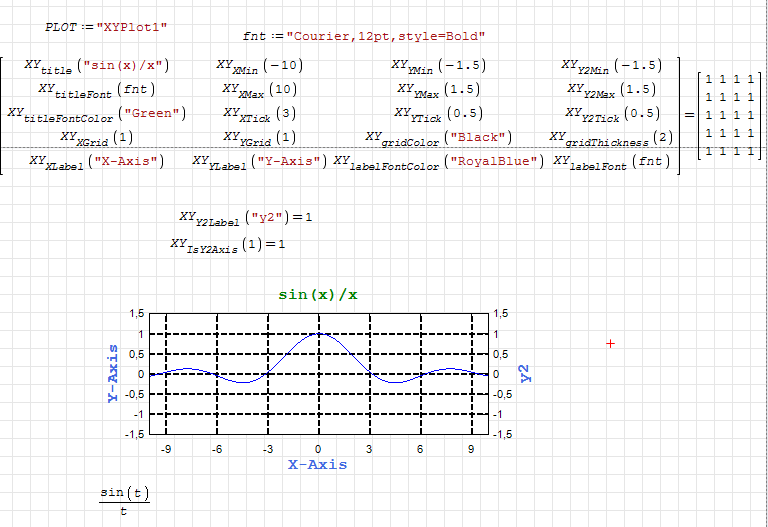
XYPlotTools.sm (48.94 KiB) downloaded 1272 time(s).
I think I just have labels left to complete.
There are some other classes that I made functions for that work such as DecimalPlaces. And some that do not such as GridPattern and NumberFormat. Not sure if they're very useful or not.
EDIT: Updated .sm with some fixes and label functions.
XYPlotTools.sm (48.94 KiB) downloaded 1272 time(s).
Feel free to join the SMath Studio Users Discord Channel: https://discord.gg/PayZpJW
#339 Posted: 8/20/2019 6:14:47 PM
setprop() function is just an intermediary. It knows nothing about the properties of an object. Thus, if a property is found during a call, then it will be set. Each time a function is called, it enumerates the available properties. It is possible that I will change this behavior by setting aliases for some properties, making the names shorter. For now you can use source code to get these names. As for the values, you can get them from sm file: .
gridpattern="Dash"Russia ☭ forever, Viacheslav N. Mezentsev
#340 Posted: 8/20/2019 7:36:23 PM
WroteNot sure if they're very useful or not.
Well, X_Y does not understand much of real projects.
kaput = kaput
- New Posts
- No New Posts