X-Y Plot Region - Extends SMath Studio with a X-Y Plot Region. - Messages
#381 Posted: 5/10/2020 9:30:13 AM
Great!
#382 Posted: 5/16/2020 11:42:12 AM
Hi!
Just to confirm: so far setprop can't address Traces both in ZedGraph and X-Y Plot, right?
Just to confirm: so far setprop can't address Traces both in ZedGraph and X-Y Plot, right?
#383 Posted: 5/16/2020 11:50:10 AM

Yes, I found out only how to do it. I will explore another way to control component settings. The correct way is to specify the variable name directly in the properties. I think that it will be more intuitive than all other methods.
Russia ☭ forever, Viacheslav N. Mezentsev
1 users liked this post
frapuano 5/16/2020 4:54:00 PM
#384 Posted: 5/16/2020 11:53:41 AM
Thank you!
#385 Posted: 5/16/2020 8:54:08 PM
Updated.
Changes:
- increased calculation speed;
- green frame restored when region in evaluation.
Changes:
- increased calculation speed;
- green frame restored when region in evaluation.
Russia ☭ forever, Viacheslav N. Mezentsev
1 users liked this post
Davide Carpi 5/17/2020 12:26:00 PM
#386 Posted: 5/17/2020 11:04:30 AM
Updated.
Changes:
- setprop() partially fixed.
Changes:
- setprop() partially fixed.
Russia ☭ forever, Viacheslav N. Mezentsev
2 users liked this post
#387 Posted: 5/20/2020 3:02:26 AM
Updated.
Changes:
- implicitplot method improved.
Changes:
- implicitplot method improved.
Russia ☭ forever, Viacheslav N. Mezentsev
#388 Posted: 6/21/2020 2:10:43 AM
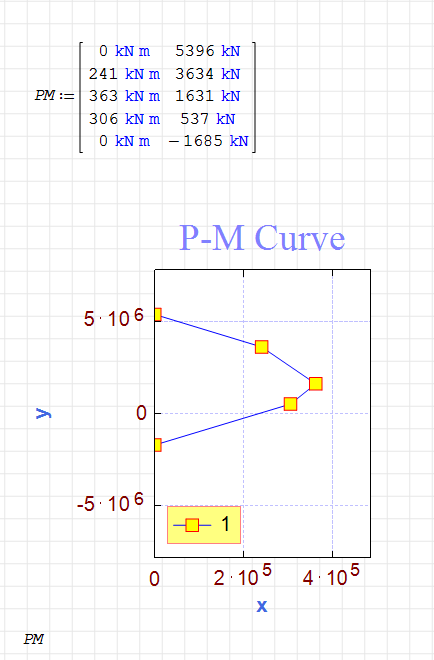
Can anyone help me with 2D plots. I have several questions.
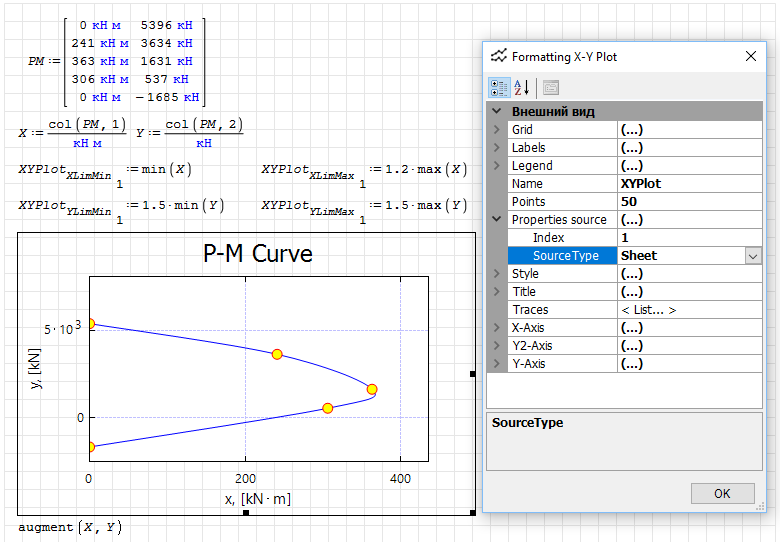
1. how do I input/show the units on the graph?
2. how do I scale the units/number on the axis. the graph is in N-mm vs N, I want to change it in kN-m vs kN.
3. is there a way to automatically adjust the max and min of values on the axis?
PM Curve.sm (5.34 KiB) downloaded 1300 time(s).
1. how do I input/show the units on the graph?
2. how do I scale the units/number on the axis. the graph is in N-mm vs N, I want to change it in kN-m vs kN.
3. is there a way to automatically adjust the max and min of values on the axis?
PM Curve.sm (5.34 KiB) downloaded 1300 time(s).
#389 Posted: 6/21/2020 2:39:47 AM
Russia ☭ forever, Viacheslav N. Mezentsev
#390 Posted: 6/21/2020 3:29:14 AM
Thanks a lot uni
#391 Posted: 6/22/2020 10:02:40 AM
You can have it more productive: Export/Interpolate
Spline Hermite Interpolation General.sm (71.83 KiB) downloaded 1261 time(s).
Spline Hermite Interpolation General.sm (71.83 KiB) downloaded 1261 time(s).
#392 Posted: 6/22/2020 12:15:29 PM
WroteYou can have it more productive: Export/Interpolate
You can have it convex polyline style: Export/interpolate.
Spline Hermite Interpolation General Polyline.sm (72.62 KiB) downloaded 1289 time(s).
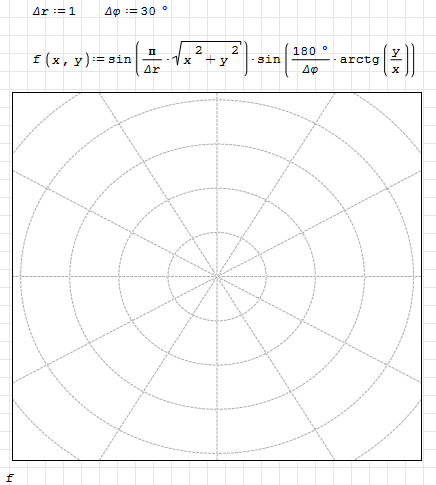
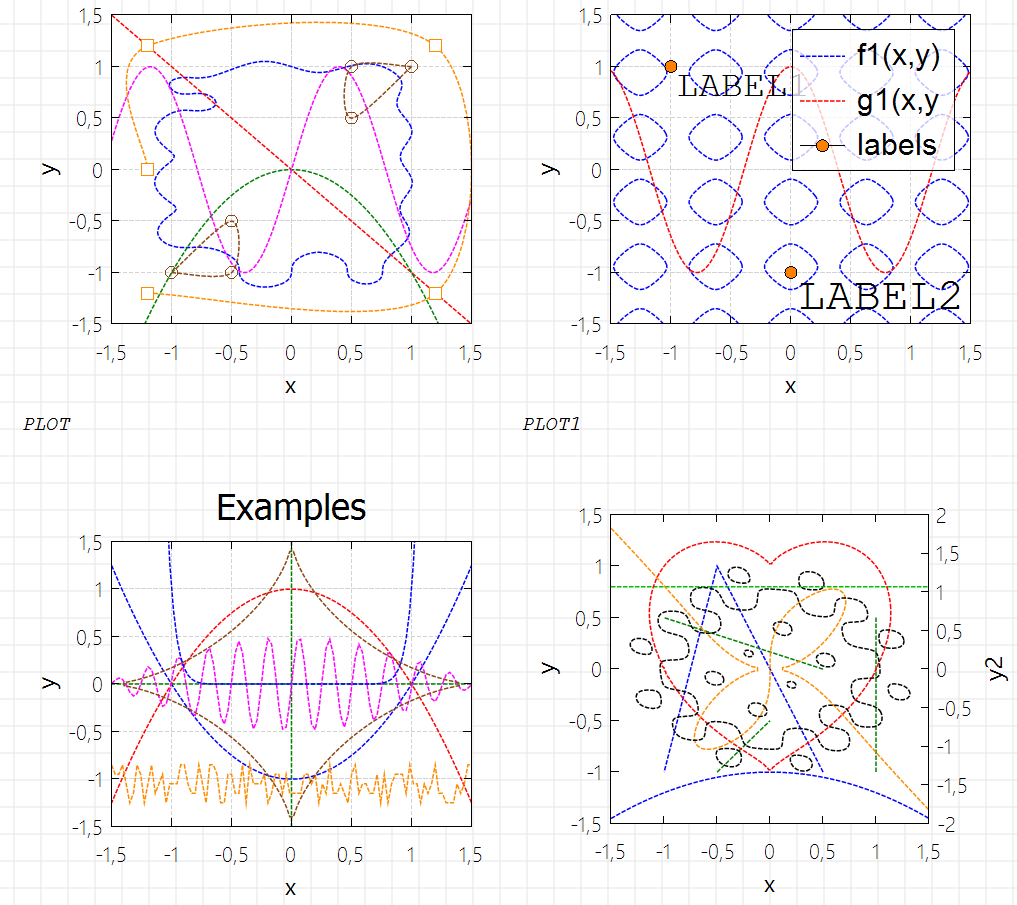
#393 Posted: 7/9/2020 9:18:01 AM
Hi,
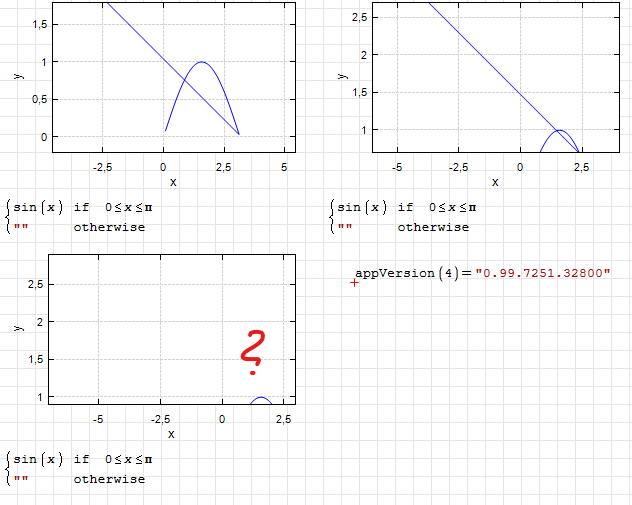
in the past, using cases (or if) to plot a function only in in specified range worked well.
Now there appears an ugly line ending nowhere.
By moving the plot range, the line disappears sometime.
Could this please be fixed? I didn't find a workaround, except of plotting tabled values.
in the past, using cases (or if) to plot a function only in in specified range worked well.
Now there appears an ugly line ending nowhere.
By moving the plot range, the line disappears sometime.
Could this please be fixed? I didn't find a workaround, except of plotting tabled values.
#394 Posted: 7/9/2020 10:21:14 AM

The problem is found with the X-YPlot plugin and not with the original 2D chart of Smath. At the moment you can use the two tricks as in the picture.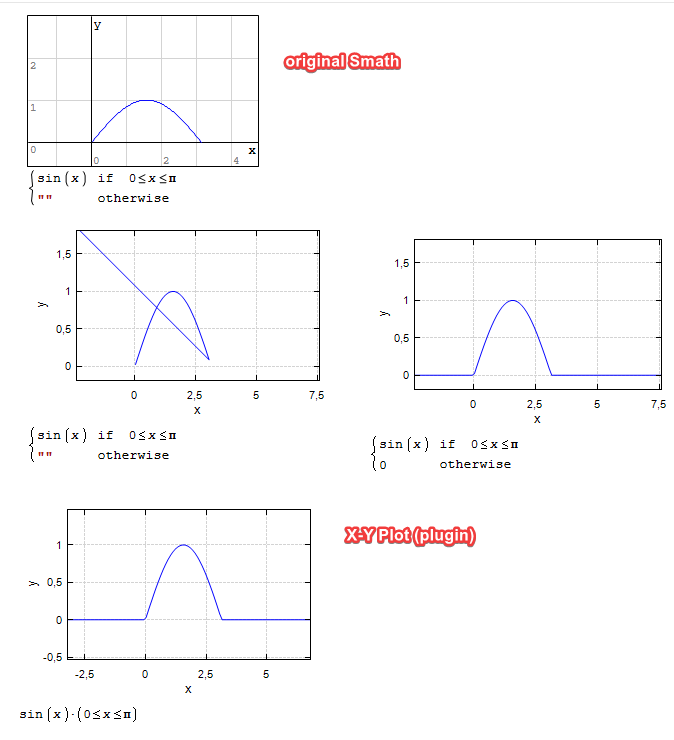
sergio
sergio
#395 Posted: 7/9/2020 11:12:38 AM
You CAN NOT blank scalar canvas plot X_Y.
Alternately, discretize /tabulate your range of interest
then plot the data in X_Y. The bonus is that on rough
data from source plot "splines" to smooth the discontinuities.
Advanced Bezier interpolation works as well.
X_Y rejects the if/otherwise blanking character "
Alternately, discretize /tabulate your range of interest
then plot the data in X_Y. The bonus is that on rough
data from source plot "splines" to smooth the discontinuities.
Advanced Bezier interpolation works as well.
X_Y rejects the if/otherwise blanking character "
#396 Posted: 7/9/2020 12:23:16 PM
WroteYou CAN NOT blank scalar canvas plot X_Y.
Alternately, discretize /tabulate your range of interest
then plot the data in X_Y. The bonus is that on rough
data from source plot "splines" to smooth the discontinuities.
Advanced Bezier interpolation works as well.
X_Y rejects the if/otherwise blanking character "
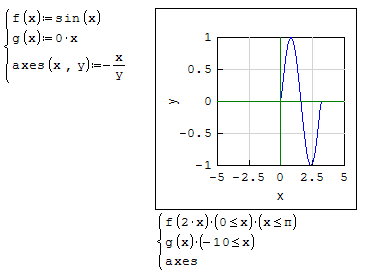
Didn't I show, that I CAN!?
I know plotting tabulated values, maybe I didn't write clearly.
#397 Posted: 7/9/2020 1:13:32 PM
plot g(x) white ... plot/no plot axes.
#398 Posted: 7/9/2020 4:25:23 PM
Yes, when adding a new feature when displaying implicit curves, I had to change the working code. I could not immediately fix the artifacts.
Russia ☭ forever, Viacheslav N. Mezentsev
#399 Posted: 7/14/2020 8:52:39 AM
Wrotein the past, using cases (or if) to plot a function only in in specified range worked well.
if/else or if/otherwise never did work at least up to SS 6179.
X_Y is essentially designed around data set.
Quite convenient but not as the champion OriginLab.
OriginLab is the software dedicated for Phamacokinetics,
hyper rich in plot styles but strictly from data sets.
IMHO, I see no point to trick/fix what ? nothing, use as is.
These two styles of demo are common as well as the 1/x.
logpts enables intelligible tabulated export and plot.
Utilities logpts Demo.sm (26.52 KiB) downloaded 1235 time(s).
- New Posts
- No New Posts