X-Y Plot Region - Extends SMath Studio with a X-Y Plot Region. - Messages

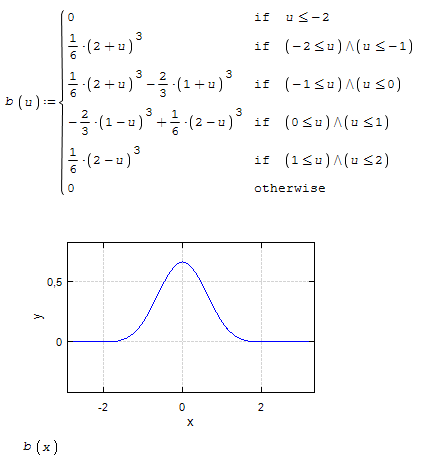
in the function definition of b(u) there is already all the data needed to properly plot the function with the X-Y plugin. Which works well.
sergio
WroteJean
in the function definition of b(u) there is already all the data needed to properly plot the function with the X-Y plugin. Which works well.
sergio
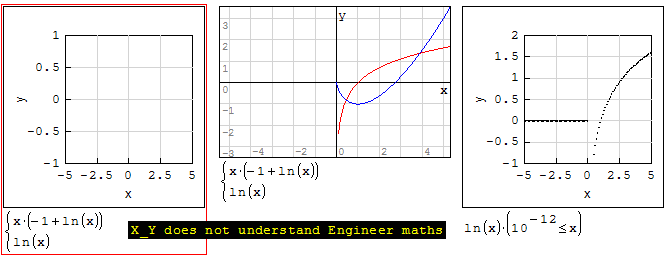
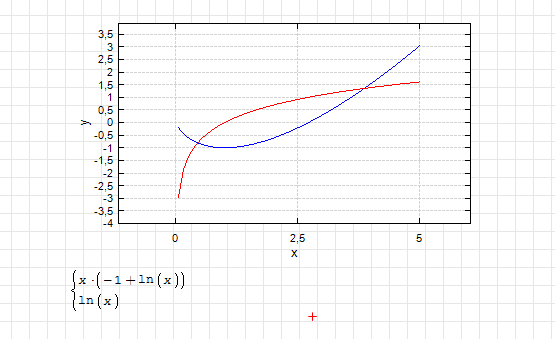
Yes Sergio, but it does not understand/plot Engineer's maths.
X_Y refers to so many libraries, it may have to be doctored.
Wrote
Yes Sergio, but it does not understand/plot Engineer's maths.
X_Y refers to so many libraries, it may have to be doctored.
Works fine for me.
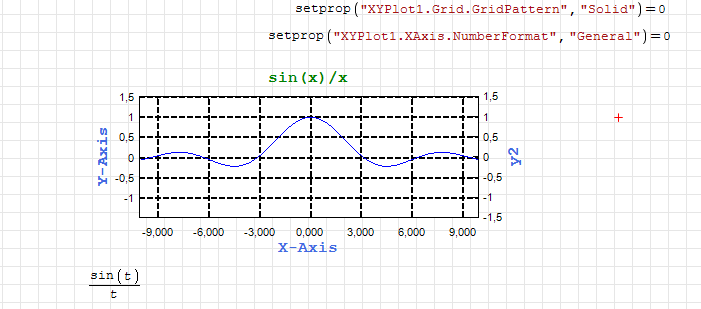
Wrotesetprop() function is just an intermediary. It knows nothing about the properties of an object. Thus, if a property is found during a call, then it will be set. Each time a function is called, it enumerates the available properties. It is possible that I will change this behavior by setting aliases for some properties, making the names shorter. For now you can use source code to get these names. As for the values, you can get them from sm file:
.gridpattern="Dash"
This doesn't seem to work for Grid.GridPattern or *Axis.NumberFormat.
WroteWorks fine for me.
Thanks alyles.
The question is about whether your X_Y version could be installed
in SS 6179, in replacement, not affecting all other projects ?

WroteThis doesn't seem to work for Grid.GridPatternor *Axis.NumberFormat.
Yes, I was wrong. This place in the code is not completed.
As for Jean's examples. He doesn't quite clearly understand the connection between the program version, the component version and its capabilities. You can stick to one old version only for yourself personally, but moving forward is impossible without updating the old one. Sometimes you need to break something for this.
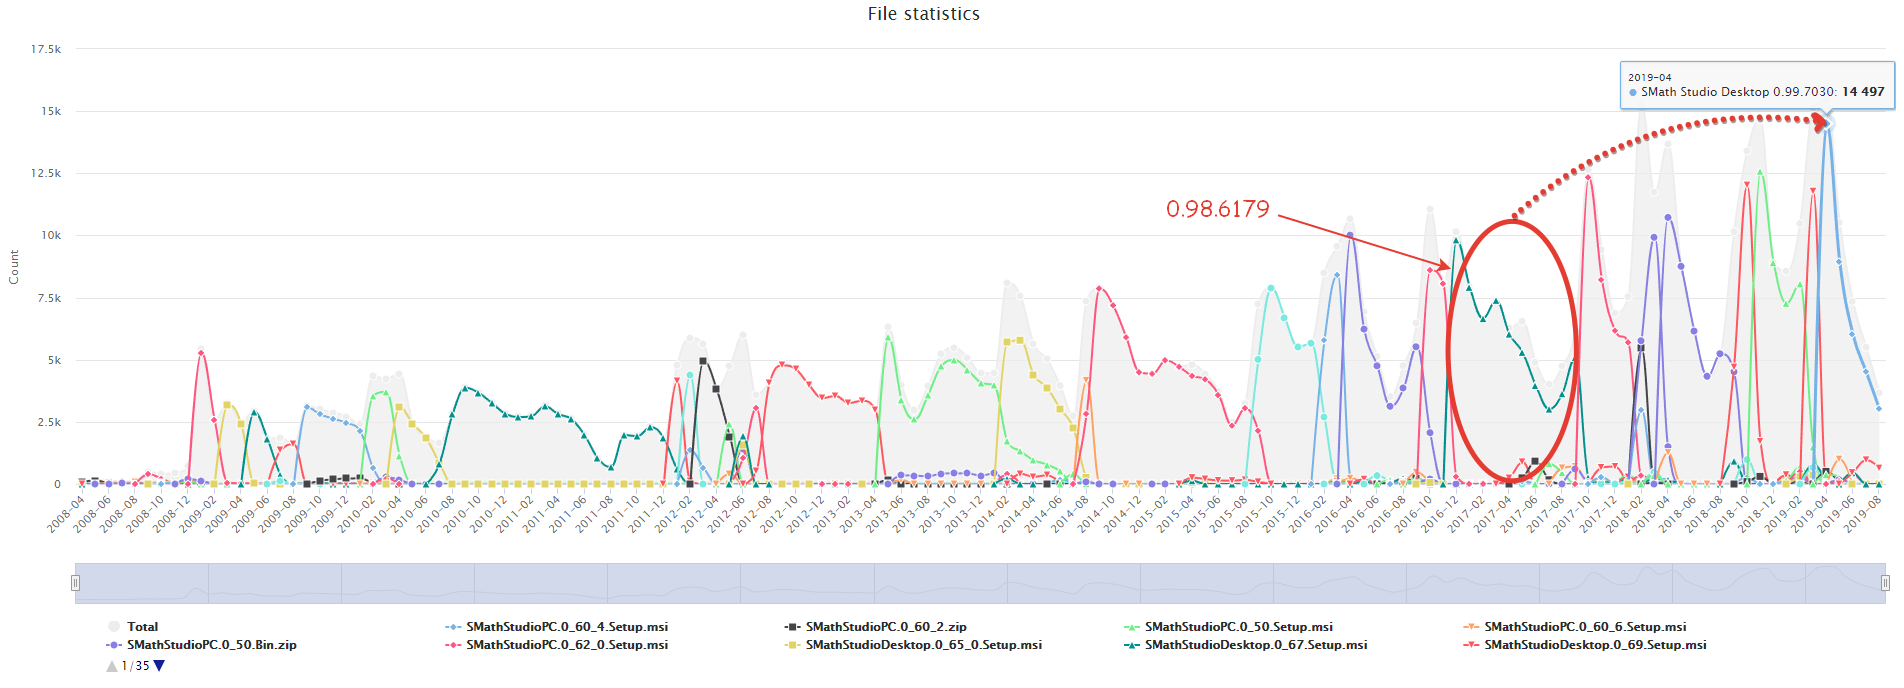
P.S. I can't support the all versions of the program. This makes sense only if all versions of the program are used at the same time, but it is not. I have access to statistics and it shows that users are migrating to new versions.
WroteAs for Jean's examples.
He doesn't quite clearly understand the connection between the program version
I can survive otherwise. What's missing in all those commands is some Russian Poetry
Don't take it bad Viacheslav ... Jean is an old monkey [you already figured that].
Changes:
- Debug parameter added to config file;
- added support simple types for setprop() function;
- some bugs fixed;
- refactored.
Hidden property for axes and GridPattern now work.
WroteUpdated.
Changes:
- Debug parameter added to config file;
- added support simple types for setprop() function;
- some bugs fixed;
- refactored.
Hidden property for axes and GridPattern now work.
Thanks Uni! I really appreciate the setprop function.
Is it possible to set individual trace properties with this function?
Thanks,
alyles
Additionally I have created some other functions that combine individual property functions to minimize number of functions necessary.
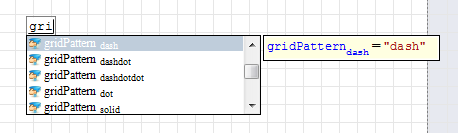
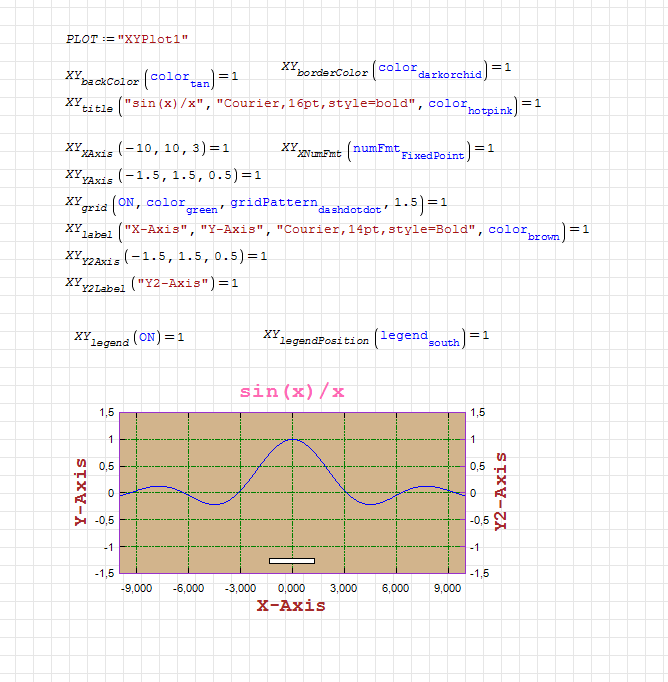
I've also created some units for things like color (color), grid Patterns (gridPattern), legendPosition(legend), number format (numFmt). This allows one to use the context menu to select pre-defined values for these items. For example, if one wants to select a different grid pattern, but cannot remember the exact string, simply start typing "gridPattern" and select from the context menu.
Attached is the raw snippet as well as a small example. Note that in the example, I have the legend on, but I have not set the parameters for traces so it's just a little rectangle. I'm hoping there is a way to change the trace parameters using the setprop command or something similar, but I'm unsure how to access them.
File not found.File not found.
WroteUpdated my snippet for the XY Plot setprop wrappers.
Interesting background color.
I had a trick to do in plot region SS 5346, din't collect, can't remember.
WroteI'm hoping there is a way to change the trace parameters using the setprop command or something similar, but I'm unsure how to access them.
It is possible, but I myself don’t yet know an easy way to do this.
Revisit the the bugs SS 7109 ... No reply from ad-noseum visits.
SS 7109 strictly useless as is --> recycle/evaporate
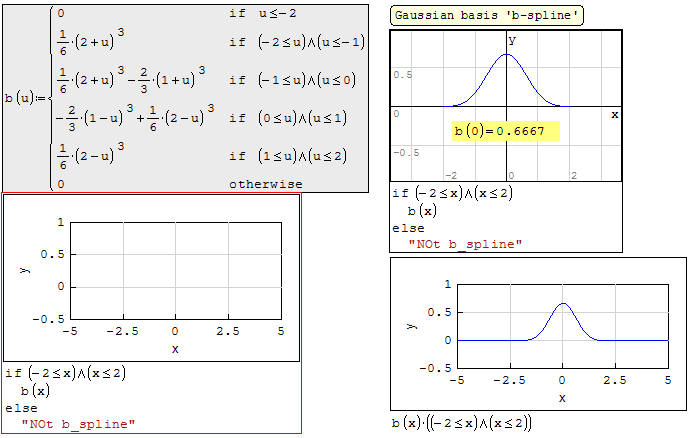
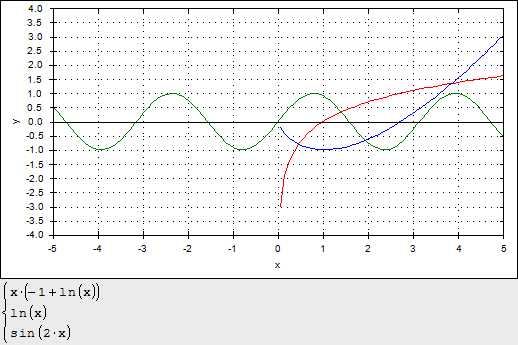
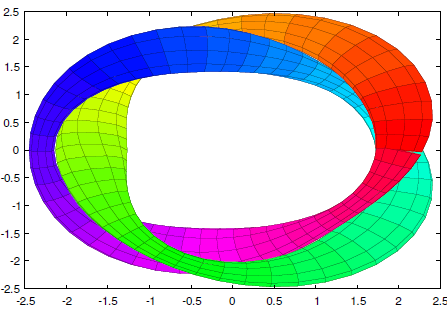
On the other hand, for what X_Y plot does well, is exceptional
from the drop down menu, very fast. The spline line/points superb !
The attached examples wrt splines is convincing of that great feature.
SS 6179 X_Y is just missing background color from the windows.
I don't fancy that so much for publishing.
The so rich plots OriginLab is from drop down menu.
Just some comments, forget.
2D Isometric.sm (92.61 KiB) downloaded 1241 time(s).
Changes:
- added AntiAlias support for legend;
- Hidden property for axes changed to Visible.
We already have this property for traces, so it’s logical to have the same name for the axes. For uniformity. I forgot about it when I chose a name.
WroteUpdated.
Changes:
- added AntiAlias support for legend;
- Hidden property for axes changed to Visible.
We already have this property for traces, so it’s logical to have the same name for the axes. For uniformity. I forgot about it when I chose a name.
Updated snippet with showAxis functions and removed hideAxis functions.
Not sure how to toggle AntiAlias options for legend using setprop or if it is possible.
XYPlotProps.sm (119.32 KiB) downloaded 1285 time(s).
WroteUpdated.
This update, I guess it is available only for SS 7109 and future builds, correct?
I am using SS 7030 and I don't see a "X-Y Plot Region" update among the available updates listed in Smath plugin manager.
Thank you, bye!
Help with this extension.
It is necessary to display a logarithmic graph, how to do it in smath?
I looked at the settings did not find such an opportunity.
- New Posts
- No New Posts