X-Y Plot Region - Extends SMath Studio with a X-Y Plot Region. - Messages
And now => attached document to best use native X_Y plot.

Changes:
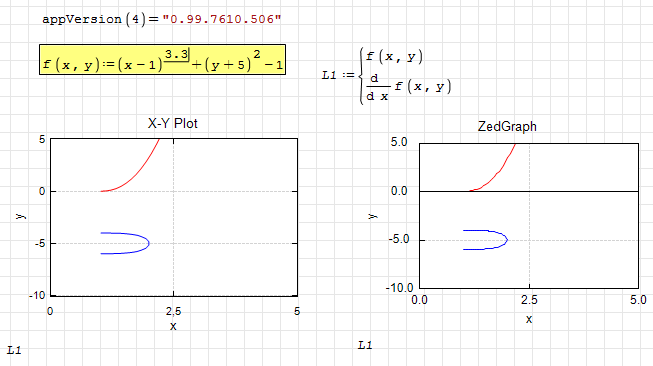
- the problem of drawing piecewise functions is partially solved.
WroteI had a question on if there is any functionality to include a picture as the graph background?
Have you tried to slide one over the other ?
No problem for background, much less irritating .
Cheers ... Jean
WroteHave you tried to slide one over the other ?
No problem for background, much less irritating .
Background and image was possible in Mathcad 11 but not in Smath.
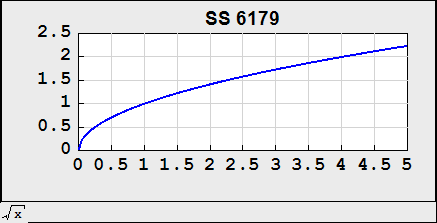
Image: yes in empty region of the graph, SS 6179.
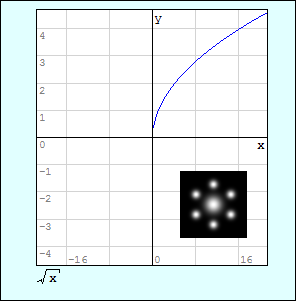
WroteThanks, I inserted a picture with a transparent background, and it worked out great.
Can you show, very interesting.
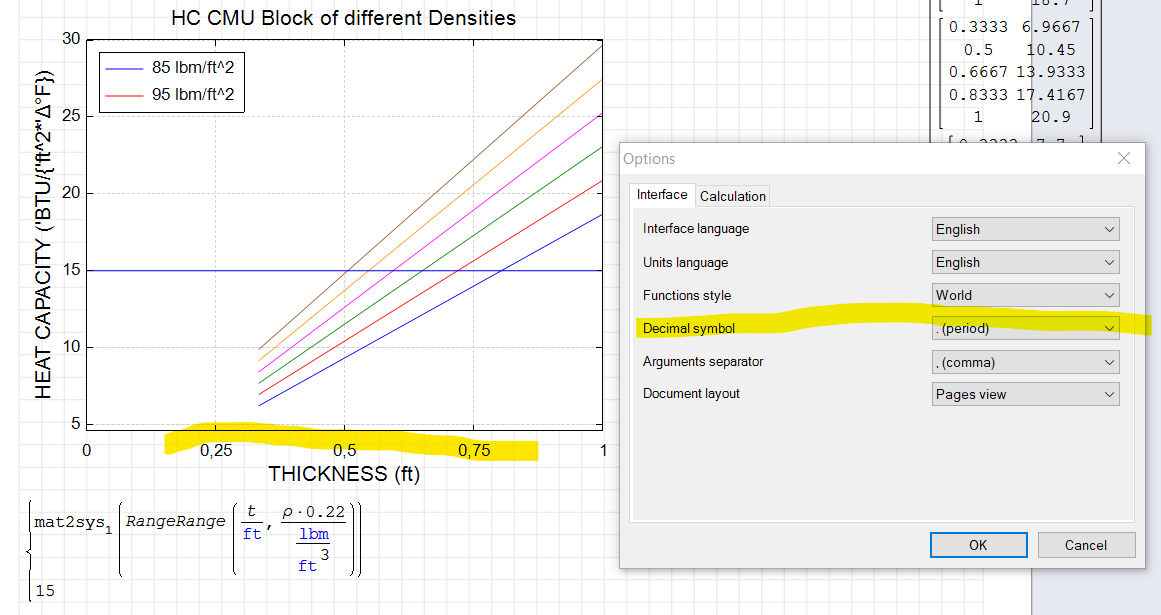
Wrotes there a reason why the X-Y Plot is showing decimals as a comma? In the US we use periods and I cannot find where it's getting the requirement
Check "Options" ... set decimal dot.
Here, we use . as decimals and never notice , decimal X_Y plot.
WroteWrotes there a reason why the X-Y Plot is showing decimals as a comma? In the US we use periods and I cannot find where it's getting the requirement
Check "Options" ... set decimal dot.
Here, we use . as decimals and never notice , decimal X_Y plot.
Exactly. My settings are decimal dot and plot is showing comma (European style).
WroteIs there a reason why the X-Y Plot is showing decimals as a comma?
The standard 2d plot also uses a comma.
WroteHere, we use . as decimals and never notice , decimal X_Y plot.
Where in your settings? Maybe it's the newer SMath version and older plugin. Your on 0.98 right?
WroteExactly. My settings are decimal dot and plot is showing comma (European style).
Is it, you can create a vector decimal dot and create project
with decimal dot but the alternate reality the X_Y is decimal coma ?
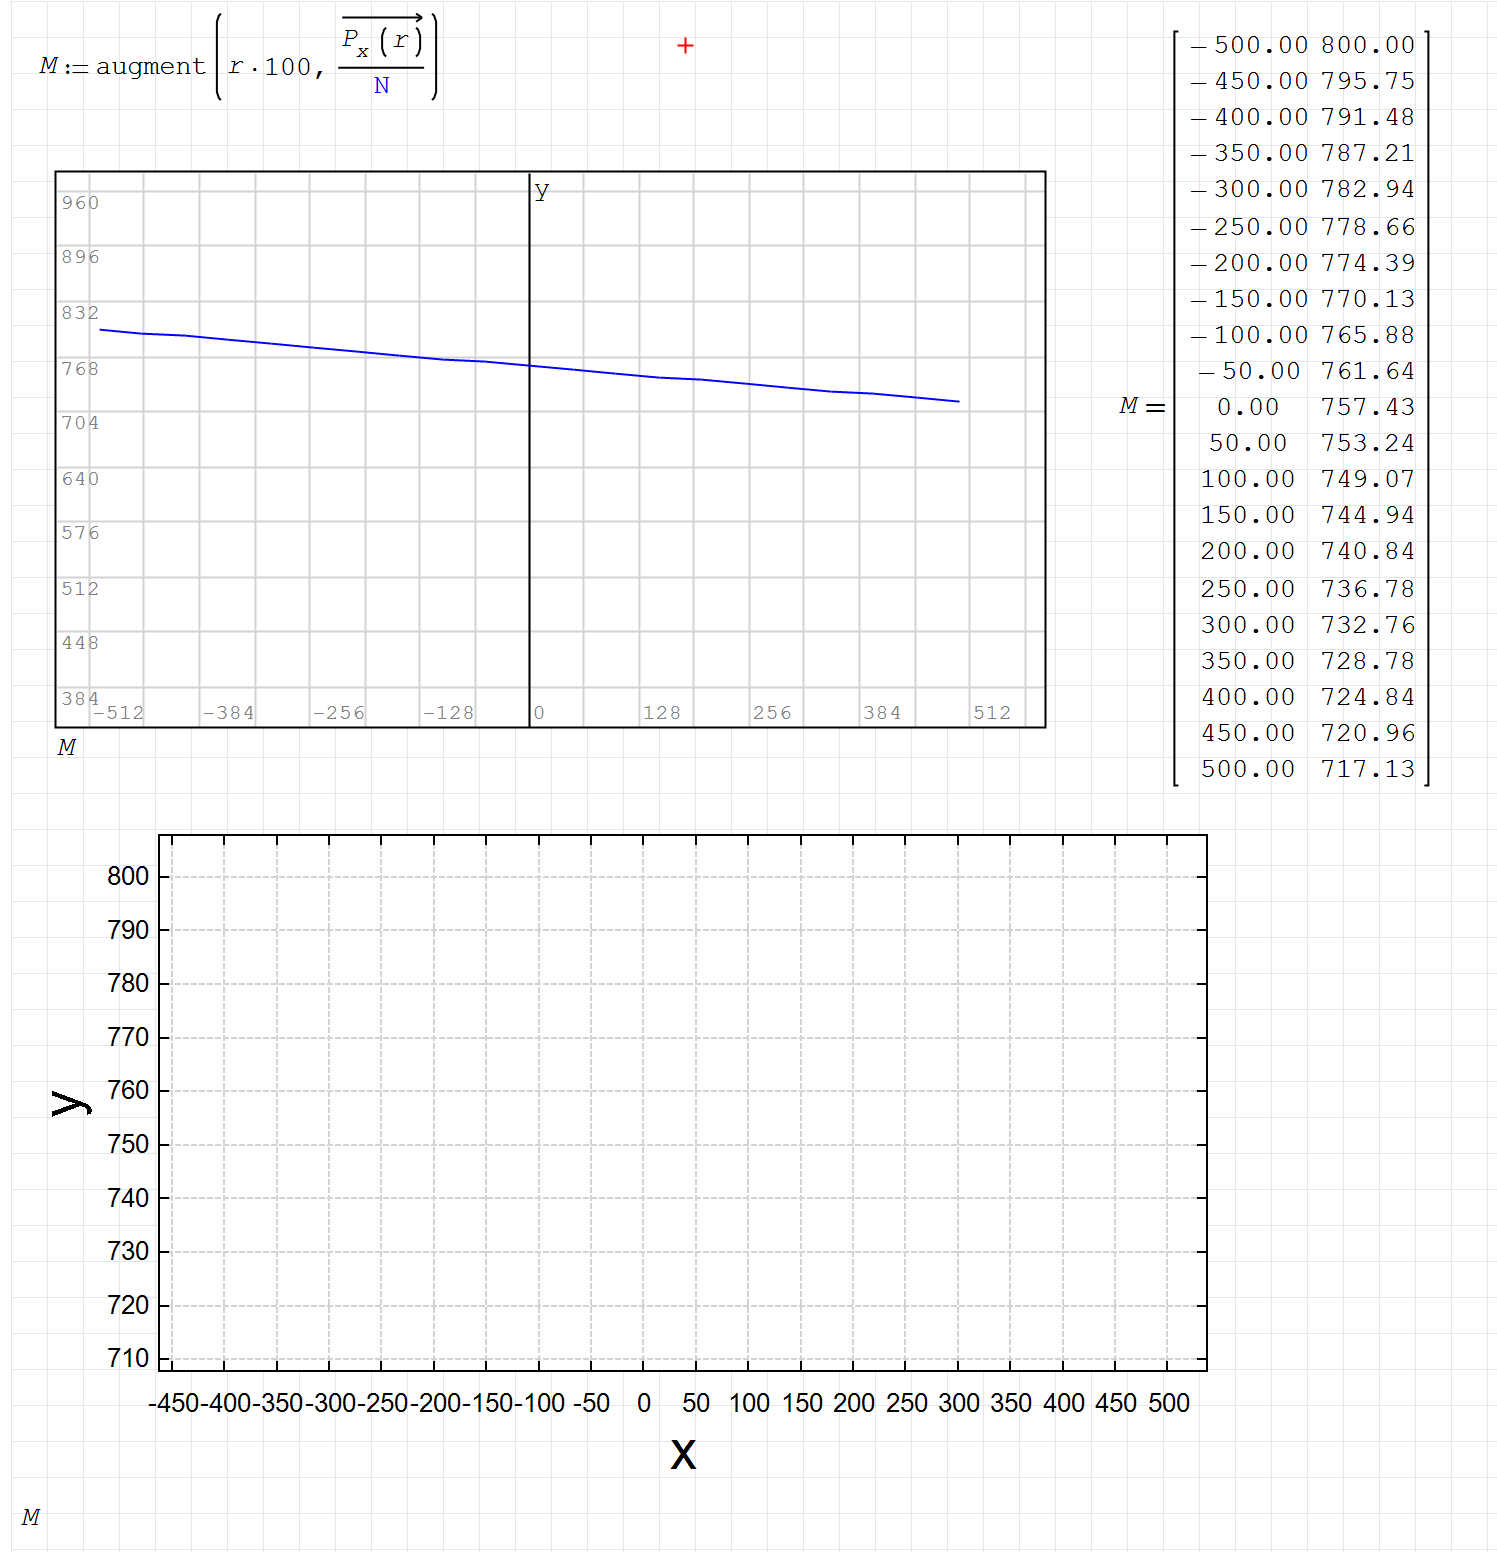
WroteWhy X-Y plot can't plot this, while plot 2D can?
Spool to file 'M' or copy/paste to isolate.
QuoteWhy X-Y plot can't polt this, while plot 2D can?
The components use different source code.
- New Posts
- No New Posts