X-Y Plot Region - Extends SMath Studio with a X-Y Plot Region. - Сообщения
WroteUnfortunately, this cannot be done yet.
Is there any other extension for smath that allows this?

WroteIt is necessary to display a logarithmic graph, how to do it in smath?
Try X_Y Zgraph.
Project Bode plot.sm (27,79 КиБ) скачан 1258 раз(а).
2D Plot Stem log10 DECADES Bode.sm (168,9 КиБ) скачан 1304 раз(а).
ZedGraph Region made a logarithmic coordinate axis and build everything
WroteZedGraph Region made a logarithmic coordinate axis and build everything
Such applications are very limited, for convenience.
IMHO, not much useful as we are born Cartesian sight.
WroteWroteZedGraph Region made a logarithmic coordinate axis and build everything
Such applications are very limited, for convenience.
IMHO, not much useful as we are born Cartesian sight.
I disagree. In electronics engineering we often deal in frequency domain with such applications as filter design, EMI/EMC, control.. just to name a few. Being able to plot on logarithmic scale is necessary in such applications.
WroteSuch applications are very limited, for convenience.
IMHO, not much useful as we are born Cartesian sight.
A great utility is the logpts for convenient tabulation/export.
Very useful to adequately populate the vertical region and not
over populate the flat region, especially for interpolation.
Utilities logpts Populate Quick.sm (14,43 КиБ) скачан 1235 раз(а).
WroteWroteUnfortunately, this cannot be done yet.
Is there any other extension for smath that allows this?
The maxima plugin allows for log plots (all functions of the draw package are available, the draw commands generate images which can be displayed using image region. Alternatively, there are interactive draw regions provided by the plugin.
See for example Ashby style material property charts
WroteWroteWroteUnfortunately, this cannot be done yet.
Is there any other extension for smath that allows this?
The maxima plugin allows for log plots ...
Hi. Can try this other one also, in SMath lang.
examples MNA RLC.sm (219,13 КиБ) скачан 1253 раз(а).
examples MNA RLC.pdf (318,62 КиБ) скачан 692 раз(а).
Best regards.
Alvaro
Wrote
Hi. Can try this other one also, in SMath lang.
examples MNA RLC.sm (219,13 КиБ) скачан 1253 раз(а).
examples MNA RLC.pdf (318,62 КиБ) скачан 692 раз(а).
Best regards.
Alvaro
wow !!!
When Uni told me that the X-U region does not support the logarithmic axis, I was upset and thought that I could do it in a standard tool. But I could not even imagine that it would be so difficult.
ZedGraf region perfectly copes with the task, it is possible to make legends (have not yet learned). We rarely use charts in calculations.
WroteWhen Uni told me that the X-U region does not support the logarithmic axis, I was upset
Disambiguate:
Smath does not have the Cartesian x,y log axis from command line
like Mathcad 11 and earlier. In lieu X_Y ZedGraph plugin.
I guess Uni [our Viacheslav] is same from former Mathsoft Collaboratory.

WroteHello!
Help with this extension.
It is necessary to display a logarithmic graph, how to do it in smath?
I looked at the settings did not find such an opportunity.
Hi, maybe you can use the information of this post: https://en.smath.com/forum/yaf_postsm7005_Signals-and-Systems.aspx#post7005
Wrote
Hi, maybe you can use the information of this post: https://en.smath.com/forum/yaf_postsm7005_Signals-and-Systems.aspx#post7005
Thanks, I'll keep it in mind.
But while the ZedGraph Region completely suits me.
WroteBut while the ZedGraph Region completely suits me.
What you can do in the linear Cartesian,
you can subdivide between integer values of the quick plot.
You can subdivide in any number of sub-intervals and log10
these sub-intervals. Then plot the stems at those intervals.
Utilities logpts SQRT X,Y.sm (28,47 КиБ) скачан 1207 раз(а).
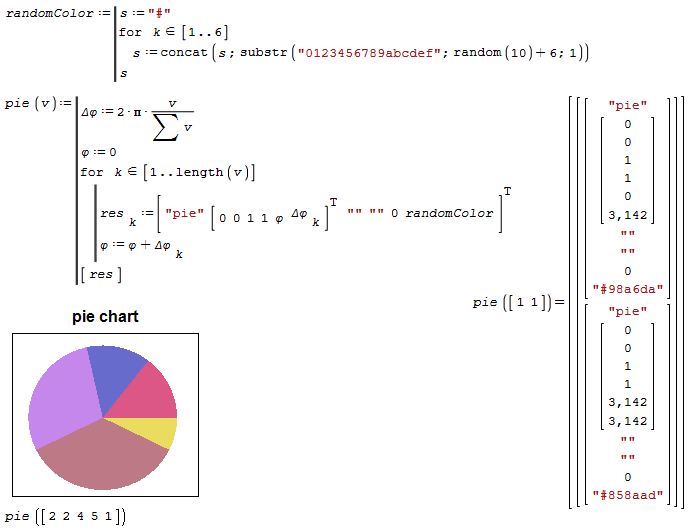
WrotePie chart with random colors
Thanks Martin, interesting but not Smath native.
Obviously fails SS 6179 and no use for concluding a document.
Cheers ... Jean
setprop() function changed for support ZedGraph region.
I've just tested it and it fixes the Viewer issue I mentioned in another post.
Any chance it can access the configurations of indivual plots inside a ZedGraph Region? In other words, is it possible to address specific Traces?
Changes:
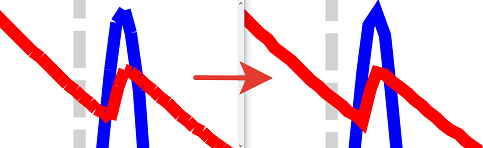
- trace quality improved;
- now default value for AntiAlias is true;
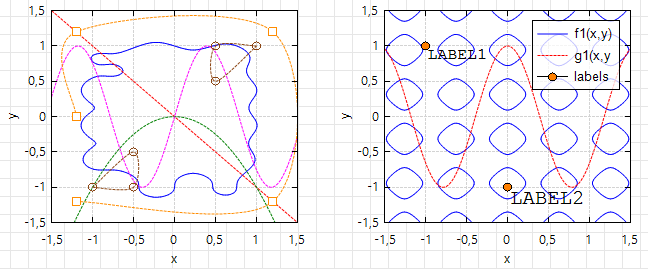
- Y2 grid lines added;
- setprop() function improved.
Theoretically, we can set the dash style for implicit functions as well, but this is more difficult to implement.
- Новые сообщения
- Нет новых сообщений