X-Y Plot Region - Extends SMath Studio with a X-Y Plot Region. - Messages
Wrote
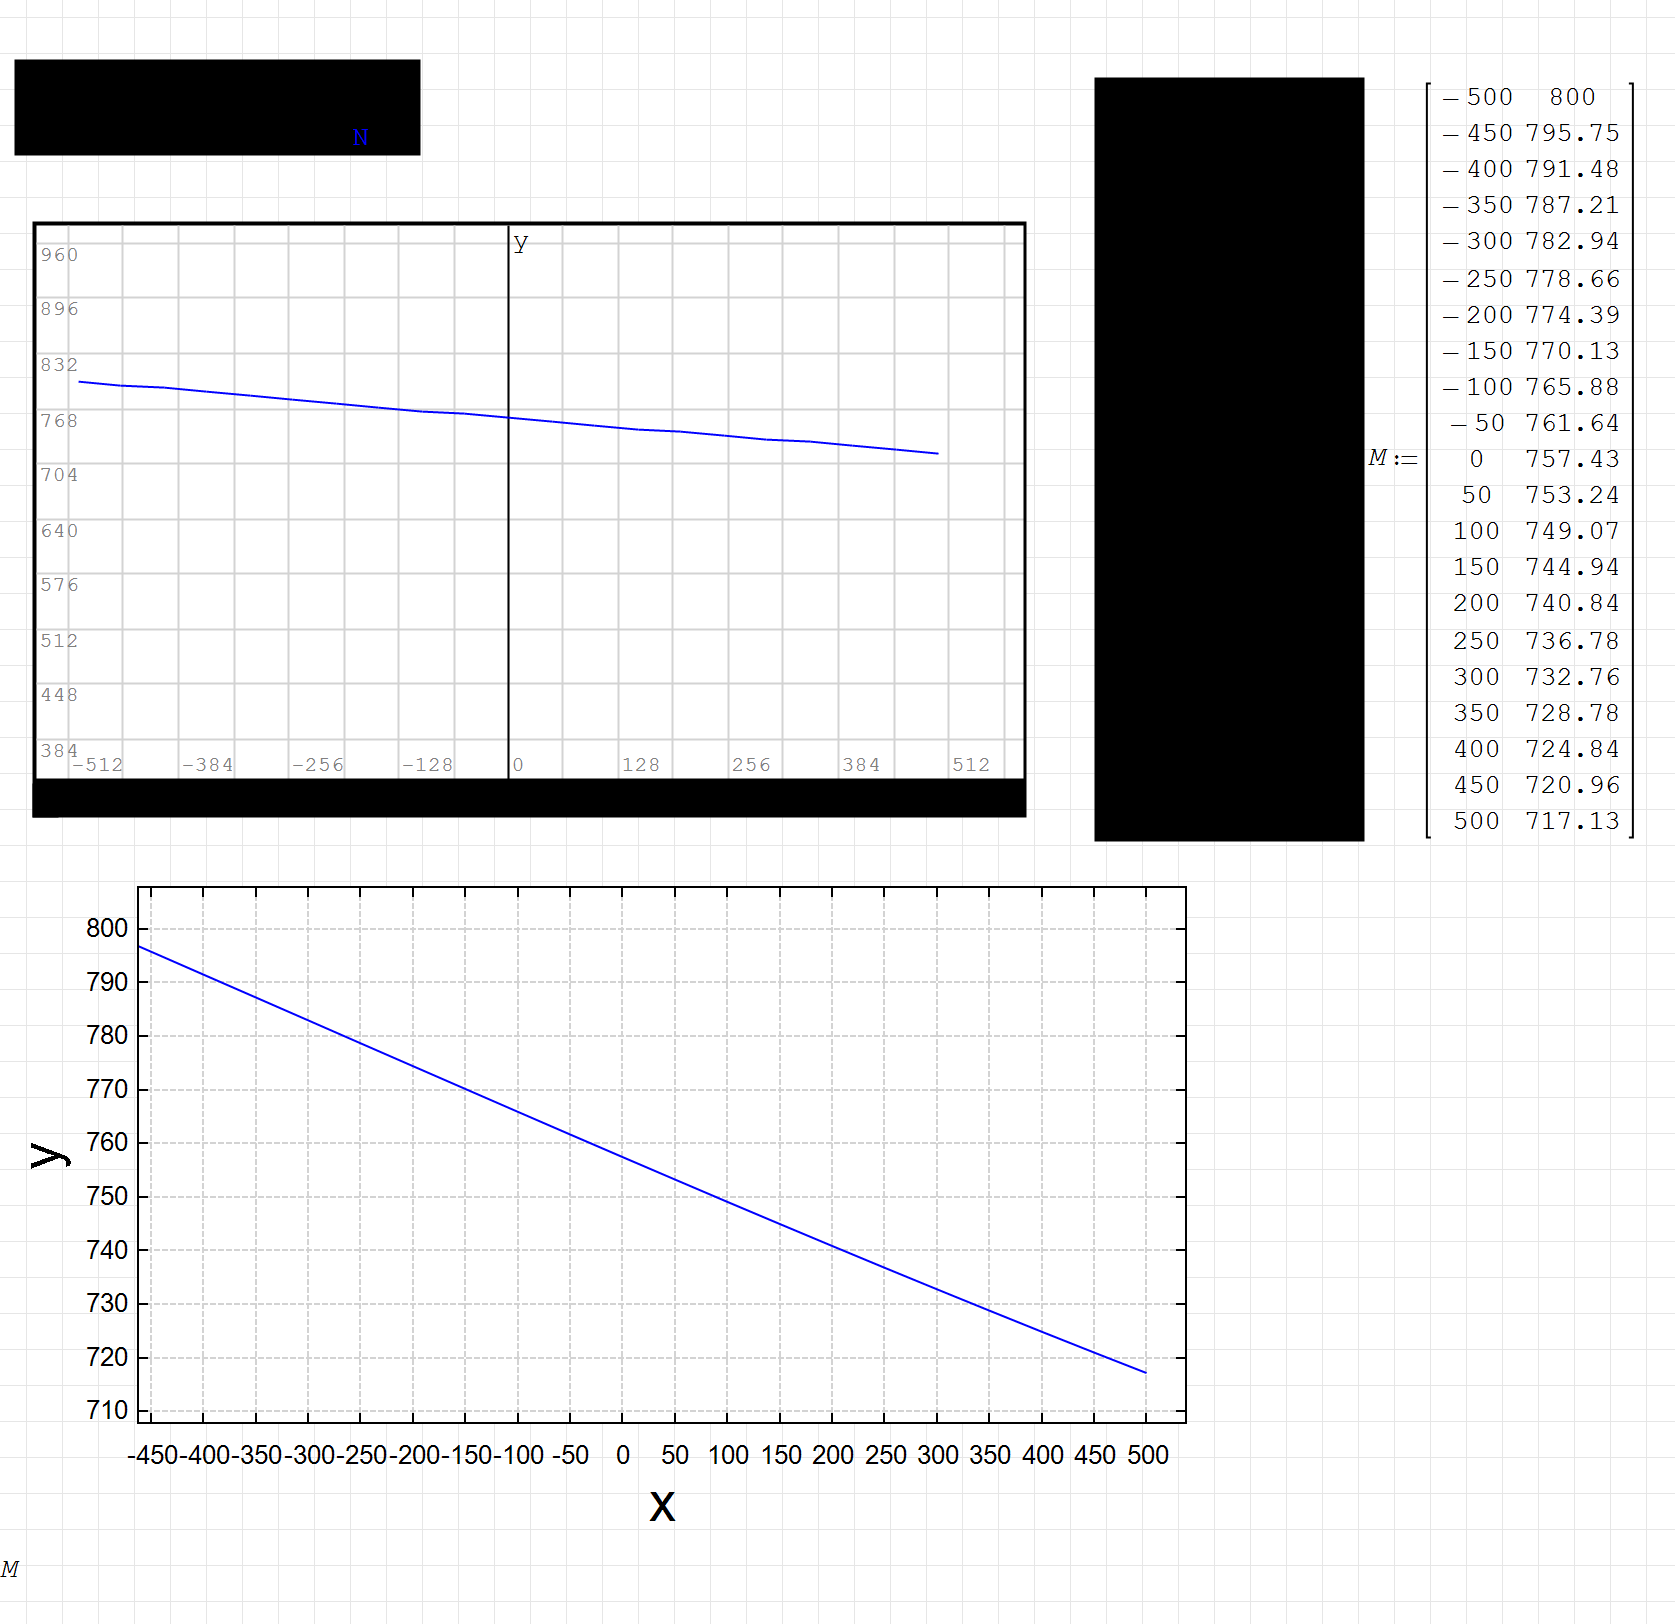
all the math regions shows black.
How do you isolate M?
WroteWhy X-Y plot can't polt this, while plot 2D can?
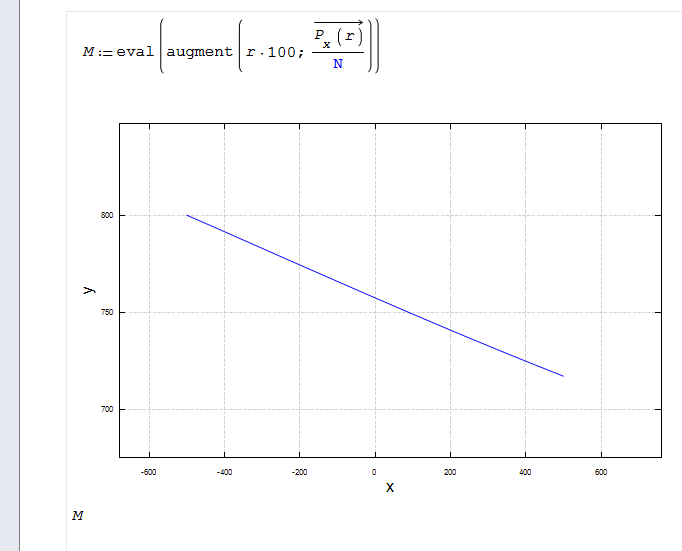
Hi. In your case use eval() as in the image. After that XY plot works.
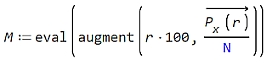
Best regards.
Alvaro.
WroteWroteWhy X-Y plot can't polt this, while plot 2D can?
Hi. In your case use eval() as in the image. After that XY plot works.
Best regards.
Alvaro.
This works for me, Thank you.
Wroteall the math regions shows black.
How do you isolate M?
all black ... select all, background white.
Spool to file is most precious in many applications... here disabled.
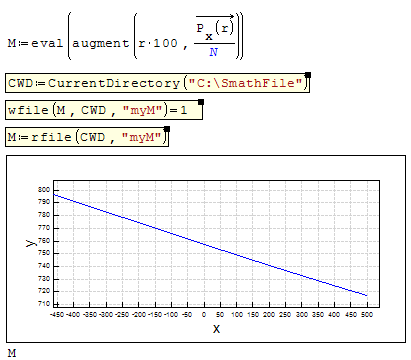

sergio

I will try to expand the type of expressions supported.
WroteIn fact it is a behavior that I did not expect. I noticed that you defined "M" symbolically. But it wasn't enough. With "eval" it works but I don't understand why
sergio
Hi Sergio. My interpretation, but not sure if it's actually the reason why. I think in terms of the Mathematica's Hold[x] instruction, or the equivalent Maple quoting with 'x'; those instructions make x remain unevaluated. In a mathematica procedure f(x), if previously you have x:=2 and call f[Hold[x+3]], f receive 'x+3' but not 5. SMath try to preserve all things unevaluated for make symbolic simplifications in cases of mixing symbolic and numeric calculations. For this is that XY plot and vectorize() function receive arguments unevaluated. In that sense eval() is the opposite to hold(), function that actually I ask for as feature suggestion.
The best example of that hold exists in SMath is the way that derivatives are evaluated, like in mathcad: you first define x:=2, then call diff(x^3,x) = 12. Notice that diff() don't receive 8 and 2 as arguments, but x^3 and x, just because you cant differentiate with something like diff(8,2). So, some functions in SMath gets it's arguments with 'hold', and it seems that vectorize() is another example, but others not.
Even that, also there are some other internals with an strange behavior for all functions: if you think that you write a function which goes to receive a big matrix as argument M, your first step in the body procedure must to be M:=M for ensure that it goes to be only numerical. Ndtma expose that in an example, but can't remember nor find where.
Best regards.
Alvaro.
Wrote... This case has not yet been investigated by me. ...
Hi Viacheslav: Just pay attention to the error message in the other post of the user with vectorize(): "t - not defined". This t is under an integral symbol. M remains unevaluated because depends on a numeric integral, which SMath try to retain unevaulated how long as can for avoid truncation errors in the same way that SMath do with pi or sqrt(2). So, if vectorize() can't deal with the numerical integral, I guess that it could be better to improve the general SMath way to determine when use the numeric value for all expressions and when retain the procedimental definition.
I guess that a way for uniformize SMath behaviors could be given checking Unknows() and IsDefined() procedures that not always agree for all expressions, and define some kind of standard way to check types in SMath. (I remember a post and a function plugin with a GetType() function too)
Best regards.
Alvaro.
Wrote"eval" it works but I don't understand why sergio
eval("expression") -
Converts the given expression from symbolic to numeric notation.
Being a function evaluation, it assigns to same name or another name.
Thus, by same token isolates and that's what X_Y wants, it wants its
own stuff [data, f(x), f(x,y) as 'f' for contour]
Within a for loop, it has the virtue of isolating internally
within the loop itself, then accelerates the for loop result.
It has the same effect as spooling to file, not confirmed Bible,
just from observation(s) ... forgive my Grand Discours made short.
Some functions that have only numeric parameters must be redefined
via the eval(,) to convert scalar 'x' for plotting on Quick plot @.
For instance: the Hypergeometric Gamma
Cheers ... Jean
Is it in beta or is it released (I see it is available in the function lists, but I didn't understand if it is fully developed or still work in progress..)?
In case, does anybody have some examples of which parameters can be set and how? I mean, some guideline about syntax to be used?
Thanks
Bye
You can find a usage example here and here.
I will follow your suggestion and wait for the new control method instead.
But then the vertical grid lines are not adjusted correctly.
WroteYou can set the maximum value on the x axis lower then the minimum value. Is that what you want to achieve?
But then the vertical grid lines are not adjusted correctly.
No, that didn't work.
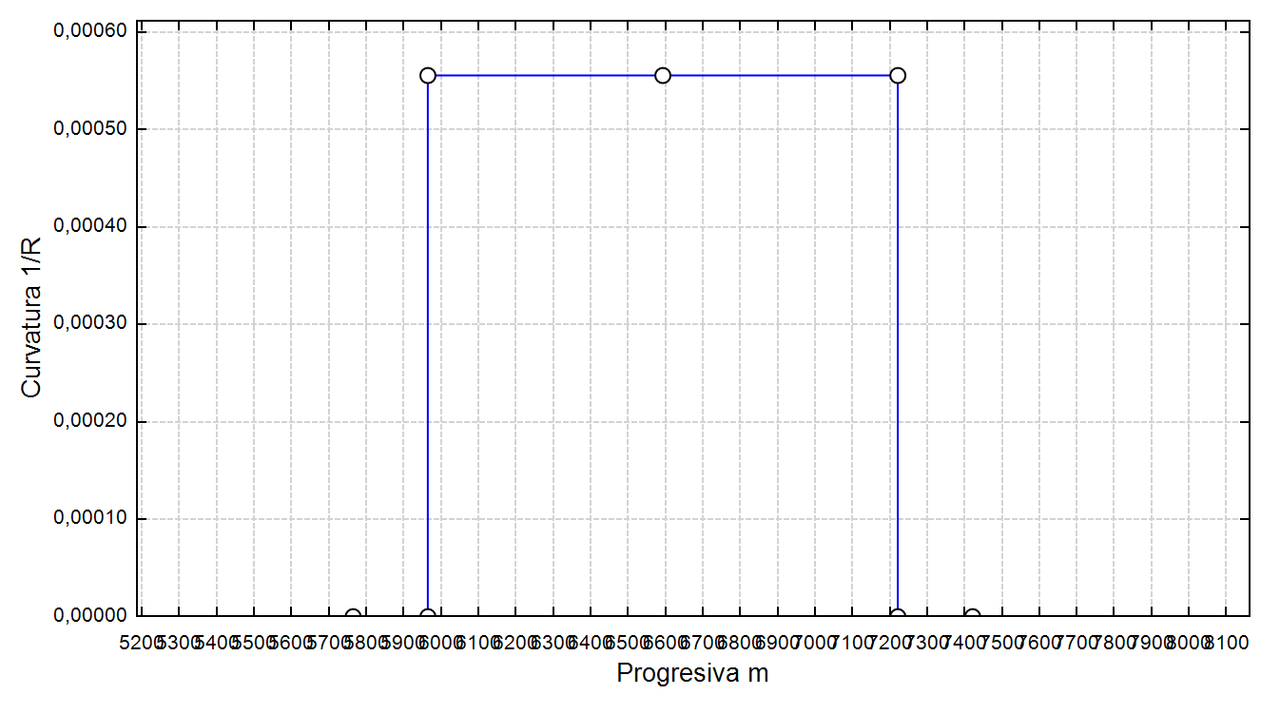
I need to change the orientation of the text in x axes.
WroteHi, there is way to rotate the X axes values ?
You can rotate ...
1. A discretized function [2 cols]
2. A drawing in 2 cols
3. Smath 3 D CreateMesh
4. RGB matrix
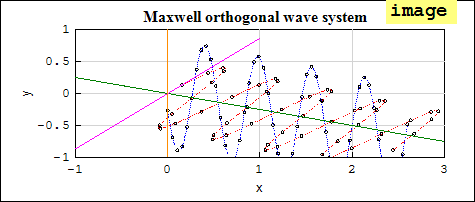
5. plot ortho on isometric X_Y plot
WroteHi, there is way to ratote the X axes values?
I think it is about rotating the tick labels on the x axis such that they don't overlap.
Unfortunately this is not possible, at least not exposed to the settings interface.
You could, however, change number format and tick spacing to mitigate the problem.
If the maxima plugin is an option for you, then you can use the draw library.
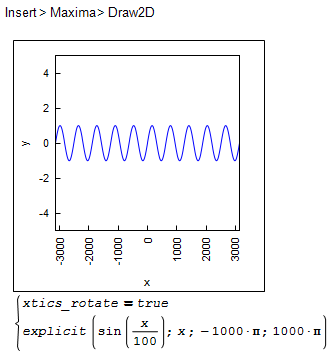
Blatt1.sm (14.2 KiB) downloaded 1248 time(s).
WroteWroteHi, there is way to ratote the X axes values?
I think it is about rotating the tick labels on the x axis such that they don't overlap.
Unfortunately this is not possible, at least not exposed to the settings interface.
You could, however, change number format and tick spacing to mitigate the problem.
If the maxima plugin is an option for you, then you can use the draw library.
Blatt1.sm (14.2 KiB) downloaded 1248 time(s).
That is exactly what I need.
I tried before doing what you suggest but i need them in a determine spacing and they sometimes overlap.
I will try with the maxima plugin.
Viel danke.
PD: the thanks button throws me an error.

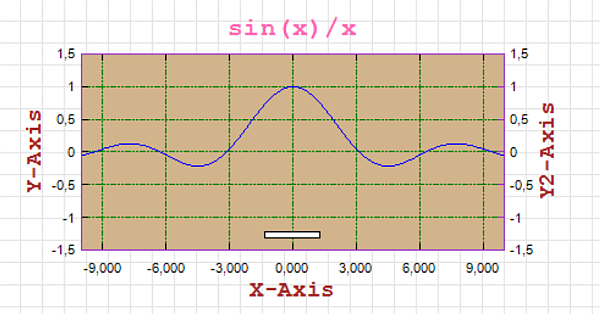
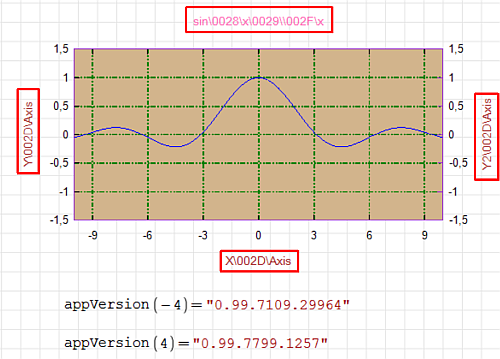
WroteUpdated my snippet for the XY Plot setprop wrappers. I have functions for each property that can be set with setprop.
In latest SS 99.7799, I experience a label error similar to image as shown.
Some previous files show this error.
- New Posts
- No New Posts